Weekend packed with macro data and possible U.S. Supreme Court decision on tariffs
The week ends with a wealth of macroeconomic data and the possible decision by the U.S. Supreme Court on tariffs. Financial markets continue to show little direction and a neutral sentiment, with concerns stemming from investments in AI weighing on Asian equities and U.S.–Iran tensions supporting oil prices. PCE inflation figures will give investors further indications about the Fed’s next moves, while PMI surveys will provide a snapshot of private-sector growth prospects at the end of February. Futures point to a positive start for Wall Street and a weak one for Europe. Among asset classes, bonds continue to show strength.
Market Weather Map
February 20, 2026
US Equities
Eu Equities
Asia Equities
Commodities
Bonds
Dollar Index
Technology
Gold
Oil
Crypto
Market Summary
How to interpret our financial indicators? Find out here.
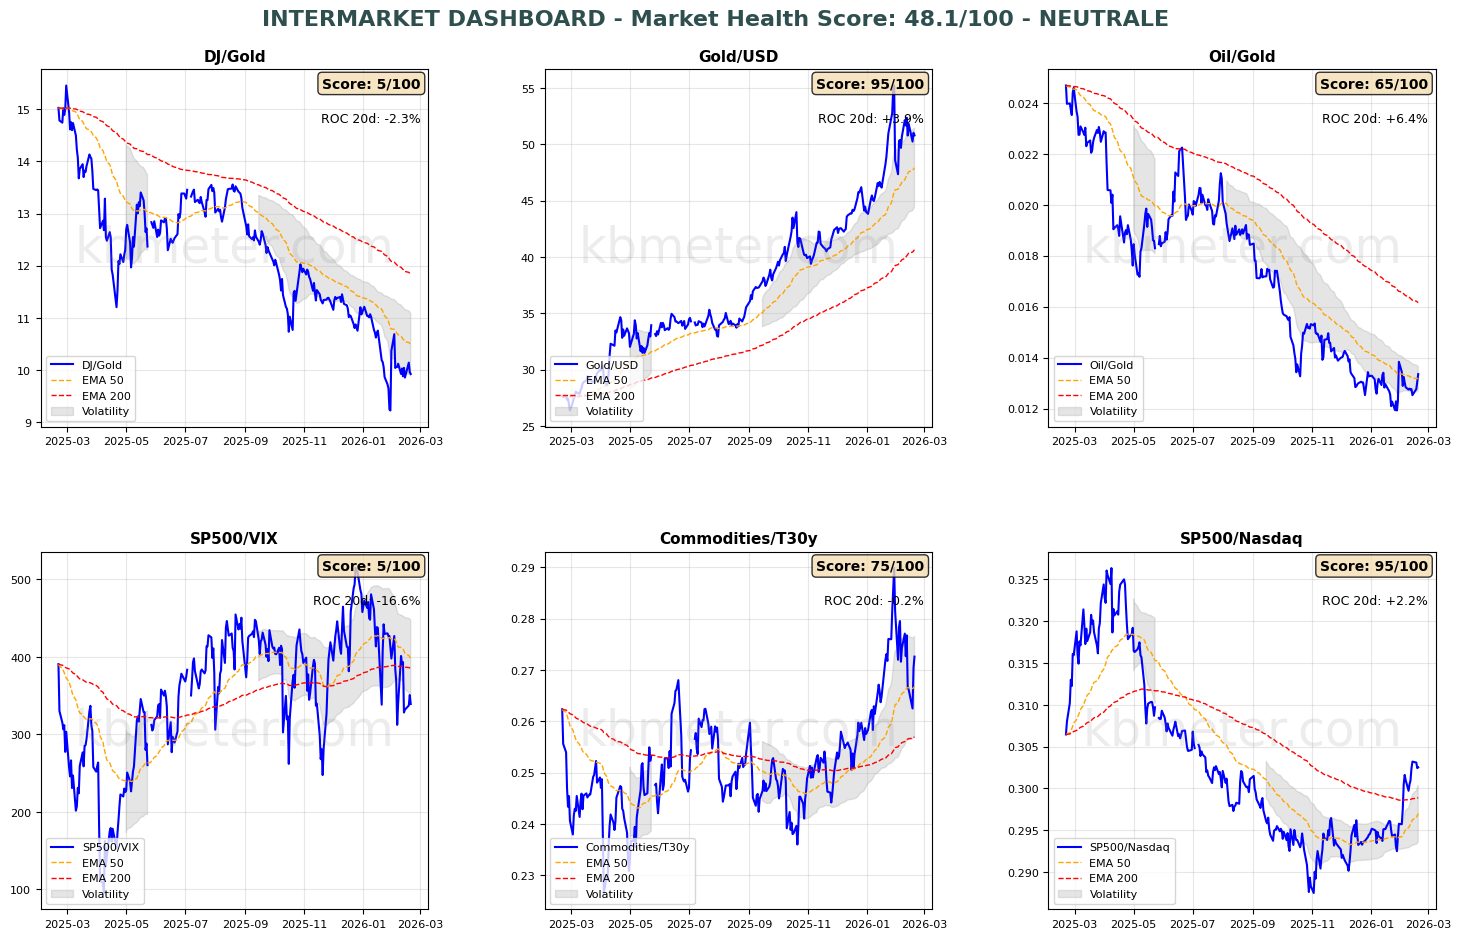
Financial markets today display a neutral sentiment. Intermarket analysis shows a Market Health Score of 48/100 (neutral). There is very little new regarding our intermarket dashboards: the week coming to a close confirms the weakness of risk indicators, some stability in gold, and the beginning of a rebound in the Oil/Gold ratio, driven by rising tensions around Iran. Asset classes continue to maintain their medium-term trends, while in the short term bonds are showing the best health.

Pre-Market Futures: Global futures indicate a moderate risk-off sentiment (-0.24% on average), with the U.S. slightly positive (+0.23%), Europe slightly negative (-0.20%), and Asia negative (-0.98%).
📊 Global Futures – Pre-Market Sentiment
- Euro Stoxx 50 derived: +0.41%
- US Tech 100 derived: +0.29%
- US 500 derived: +0.27%
- CSI 300: -1.69%
- FTSE MIB derived: -1.25%
- IBEX 35 derived: -1.08%
📄 Detailed Intermarket Analysis
INTERMARKET ANALYSIS - 2026-02-20
============================================================

MARKET HEALTH SCORE: 48.1/100
SENTIMENT: NEUTRAL

============================================================
SUMMARY OF MAIN RATIOS
============================================================


DJ/Gold:
  - Component score: 5.0/100
  - Current value: 9.9269
  - Position vs EMA50: BELOW
  - ROC 20 days: -2.27%
  - ROC 50 days: -12.79%
  → Flight to safe haven

Gold/USD:
  - Component score: 95.0/100
  - Current value: 50.8108
  - Position vs EMA50: ABOVE
  - ROC 20 days: +3.86%
  - ROC 50 days: +19.39%

Oil/Gold:
  - Component score: 65.0/100
  - Current value: 0.0134
  - Position vs EMA50: ABOVE
  - ROC 20 days: +6.41%
  - ROC 50 days: -6.39%
  → Rising energy demand

SP500/VIX:
  - Component score: 5.0/100
  - Current value: 339.1938
  - Position vs EMA50: BELOW
  - ROC 20 days: -16.63%
  - ROC 50 days: -23.92%
  → Contracting risk appetite

Commodities/T30y:
  - Component score: 75.0/100
  - Current value: 0.2726
  - Position vs EMA50: ABOVE
  - ROC 20 days: -0.17%
  - ROC 50 days: +5.67%
  → Economic growth expectations

SP500/Nasdaq:
  - Component score: 95.0/100
  - Current value: 0.3025
  - Position vs EMA50: ABOVE
  - ROC 20 days: +2.19%
  - ROC 50 days: +3.82%

============================================================
CONCLUSIONS AND RECOMMENDATIONS
============================================================

The market is in a neutral/sideways phase. Mixed signals across the various ratios.
There is no clear directional bias. Wait for confirmation.
Positioning: BALANCED, avoid excess exposure.


STRONGEST RATIOS:
  • Gold/USD: 95.0/100
  • SP500/Nasdaq: 95.0/100
  • Commodities/T30y: 75.0/100

WEAKEST RATIOS:
  • Oil/Gold: 65.0/100
  • DJ/Gold: 5.0/100
  • SP500/VIX: 5.0/100

============================================================
Analysis automatically generated by kbmeter.com
Date: 2026-02-20
📄 Detailed Asset Allocation Analysis
ASSET ALLOCATION & REGIME ANALYSIS - 2026-02-20
======================================================================

MARKET REGIME: RISK-ON - UNSTABLE COMMODITIES
REGIME SCORE: 95.0/100

======================================================================
TREND AND VOLATILITY ANALYSIS
======================================================================

GLOBAL EQUITIES (ACWI):
  Short-Term Trend (5d): +0.47% | ABOVE EMA 10
  Medium-Term Trend (20d): +1.06% | ABOVE EMA 50
  Long-Term Trend (60d): +7.88% | ABOVE EMA 200

  Volatility 5d: 11.3%
  Volatility 20d: 12.4%
  Volatility 60d: 10.8%

COMMODITIES (DBC):
  Medium-Term Trend (20d): +2.91% | ABOVE EMA 50
  Volatility 20d: 28.6%

ACWI/BND Correlation (30d): -0.062

REGIME INTERPRETATION:
The market is in a risk-on regime. Equities show positive trends across multiple
time horizons and volatility remains contained. Investors favor risk assets.
Suggested positioning: OVERWEIGHT equities.

⚠️ COMMODITIES ALERT: Commodities are showing elevated volatility. This may
indicate uncertainty about economic growth or unstable supply/demand dynamics.

======================================================================
ASSET RANKING - WHICH IS PERFORMING BEST?
======================================================================

🥇 1. Global Equities (ACWI) - SCORE: 100/100
     Price: $146.34
     Trend: ABOVE EMA10 | ABOVE EMA50 | ABOVE EMA200
     Performance: 5d +0.47% | 20d +1.06% | 60d +7.88%
     Volatility: 5d 11.3% | 20d 12.4% | 60d 10.8%
     Drawdown: -0.93%
     → Asset in STRONG HEALTH: positive trends and controlled volatility

🥈 2. Global Bonds (BND) - SCORE: 100/100
     Price: $74.82
     Trend: ABOVE EMA10 | ABOVE EMA50 | ABOVE EMA200
     Performance: 5d +0.21% | 20d +1.21% | 60d +1.40%
     Volatility: 5d 3.7% | 20d 2.8% | 60d 2.9%
     Drawdown: -0.08%
     → Asset in STRONG HEALTH: positive trends and controlled volatility

🥉 3. Commodities (DBC) - SCORE: 90/100
     Price: $24.43
     Trend: ABOVE EMA10 | ABOVE EMA50 | ABOVE EMA200
     Performance: 5d +2.65% | 20d +2.91% | 60d +12.08%
     Volatility: 5d 30.5% | 20d 28.6% | 60d 19.5%
     Drawdown: -3.44%
     → Asset in STRONG HEALTH: positive trends and controlled volatility

======================================================================
CORRELATION ANALYSIS - CURRENT vs HISTORICAL
======================================================================

ACWI/BND:
  Current correlation (30d): -0.062
  Historical average (1 year): +0.158
  Deviation: -0.221
  → Weak correlation: moderate diversification

BND/DBC:
  Current correlation (30d): -0.264
  Historical average (1 year): -0.178
  Deviation: -0.086

ACWI/DBC:
  Current correlation (30d): +0.276
  Historical average (1 year): +0.170
  Deviation: +0.106

======================================================================
OPERATIONAL SUMMARY
======================================================================

STRONGEST ASSET: Global Equities (Score: 100/100)
WEAKEST ASSET: Commodities (Score: 90/100)

SUGGESTED ACTION: Favor the strongest asset, maintain risk exposure.
DIVERSIFICATION: EXCELLENT - Asset classes are moving independently.

======================================================================
Analysis automatically generated by kbmeter.com
Date: 2026-02-20
On the macroeconomic front, today’s agenda includes the flash estimates of the February 2026 PMI surveys, UK retail sales data for early 2026, the new estimate of growth for the last quarter of 2025, and the PCE inflation figures in the United States. Also from the U.S. will come the final February reading of the University of Michigan consumer sentiment index.
On the earnings front, Warner Bros. is scheduled to report results today.
Already a subscriber? Login here
NOTES AND WARNINGS
Analysis automatically generated by kbmeter.com. Analysis date: 20 February 2026 - 7:21 AM GMT+1
This content is provided for informational purposes only and should not be considered financial advice. All scores and assessments are based on the previous trading day’s closing prices. Futures indications refer to the date and time of the analysis.