Wednesday Packed With Macro Data and Four Mag7 Earnings as Markets Search for Direction
It is shaping up to be a Wednesday packed with macroeconomic data releases and major earnings reports across financial markets. After several days of limited directionality, today there will be no shortage of market movers: from the earnings results of four of the Magnificent Seven, to inflation data from Germany, and what could be the final Federal Reserve meeting chaired by Jerome Powell.
Sentiment remains neutral but tilted to the upside. Volatility is still elevated, while inflation expectations remain firm, weighing on gold. Oil is fluctuating amid stalled negotiations between the United States and Iran, alongside the “bombshell” news of the UAE’s exit from OPEC. Futures point to a positive open in the United States and a flat start for Europe.
Market Weather Map
April 29, 2026
US Equities
Eu Equities
Asia Equities
Commodities
Bonds
Dollar Index
Technology
Gold
Oil
Crypto
Market Summary
Financial Markets sentiment
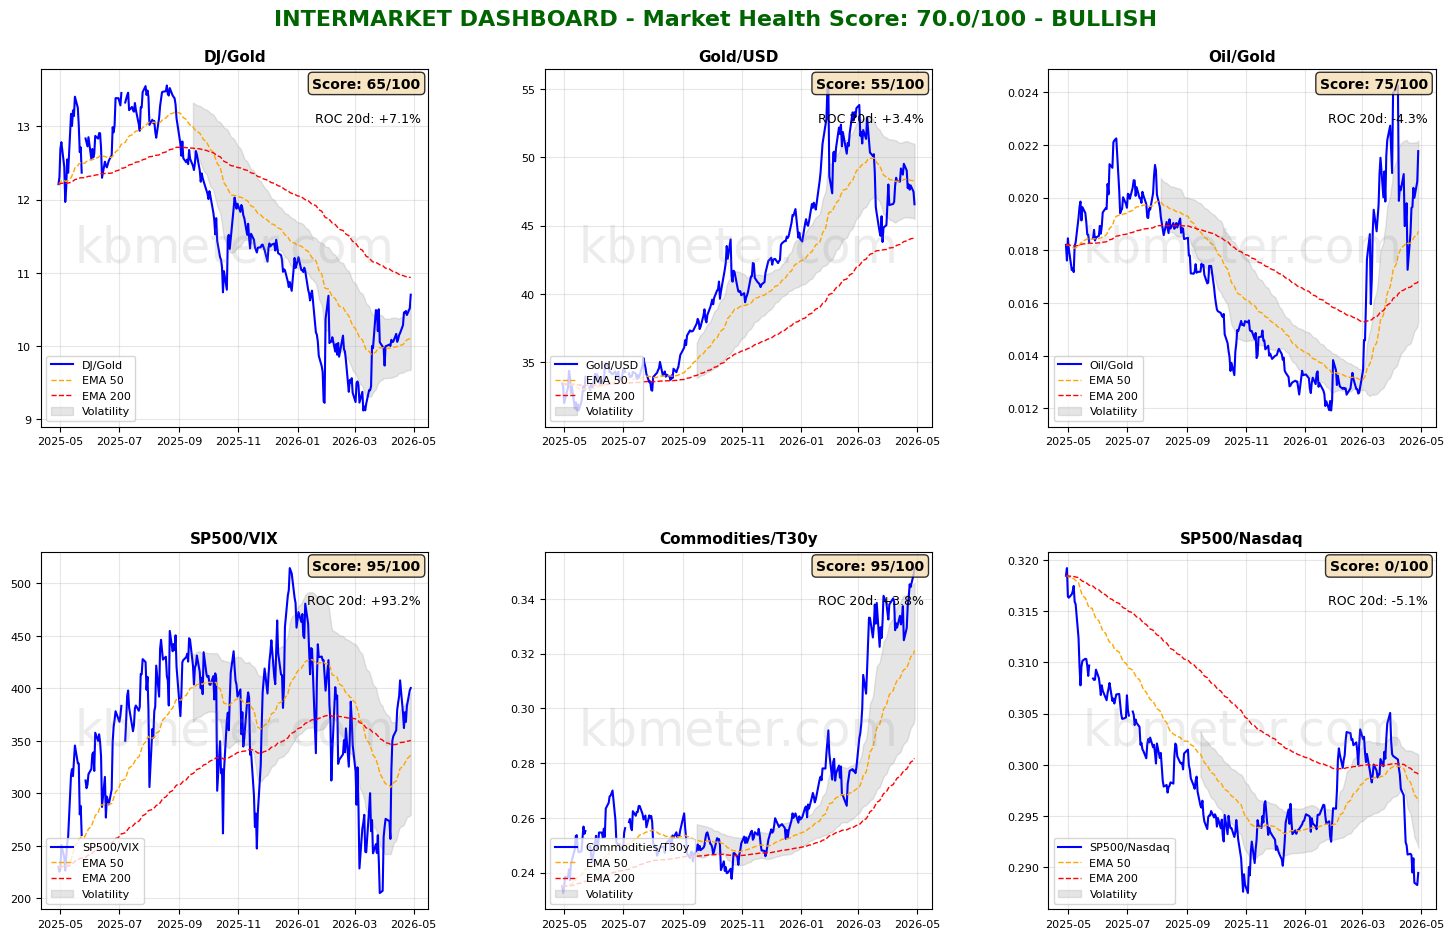
Financial markets are showing a neutral sentiment today. Intermarket analysis highlights a Market Health Score of 70/100 (positive). Our intermarket dashboards show no major changes, and the overall picture remains consistent with yesterday’s analysis. Worth noting is the continued short-term weakness in gold, which is losing strength both relative to oil (itself pressured by the UAE’s decision to leave OPEC) and relative to the Dow. This latter ratio is approaching the resistance zone represented by the long-term moving average.
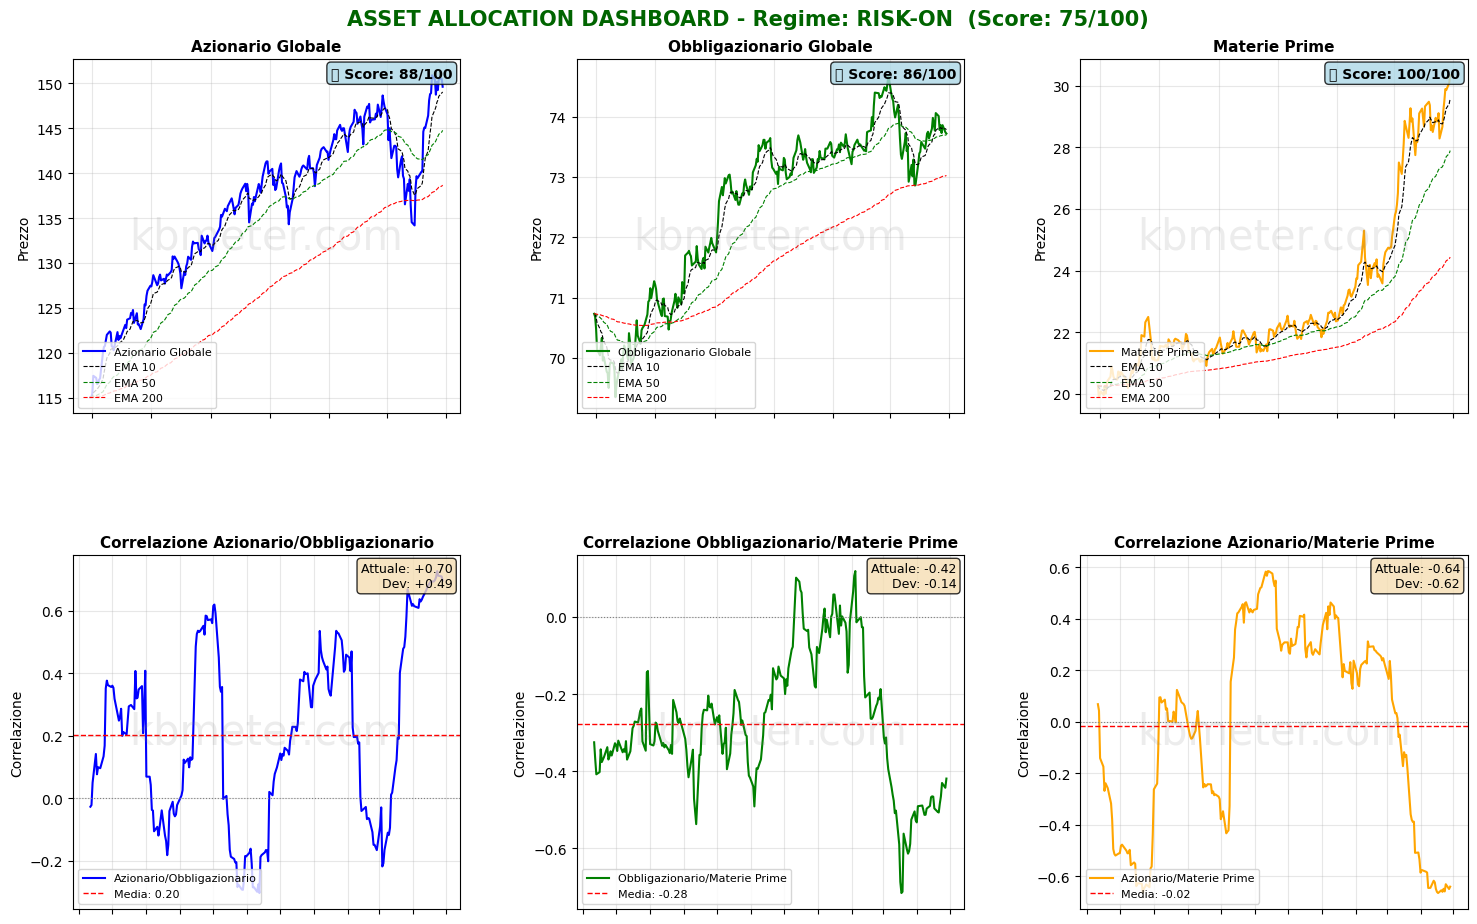
As for asset classes, there are no significant developments for now. We will see how tech-sector earnings and the Fed meeting influence the direction of global equities and bonds. At present, we simply note that the correlation between stocks and bonds remains positive and strong.
Regarding our market weather map, scores continue to favor U.S. equities, particularly the technology sector, despite negative headlines surrounding OpenAI. European equity markets appear weaker.
Global Futures – Pre-Market Sentiment
Pre-Market Futures: Global futures indicate a moderately risk-on sentiment (+0.15% on average), with the U.S. slightly positive (+0.30%), Europe broadly flat (-0.00%), and Asia slightly positive (+0.41%).
📊 Global Futures – Pre-Market Sentiment
- Nikkei 225 derived: +0.81%
- FTSE MIB derived: +0.77%
- Hang Seng derived: +0.75%
- TecDAX derived: -1.41%
- CSI 300: -0.34%
- Mini MDAX derived: +0.00%
Intermarket details
📄 Detailed Intermarket Analysis
INTERMARKET ANALYSIS - 2026-04-29
============================================================

MARKET HEALTH SCORE: 70.0/100
SENTIMENT: BULLISH

============================================================
MAIN RATIOS SUMMARY
============================================================


DJ/Gold:
  - Component score: 65.0/100
  - Current value: 10.7028
  - Position vs EMA50: ABOVE
  - 20-day ROC: +7.13%
  - 50-day ROC: +8.58%
  → Preference for risk assets vs safe haven

Gold/USD:
  - Component score: 55.0/100
  - Current value: 46.5575
  - Position vs EMA50: BELOW
  - 20-day ROC: +3.39%
  - 50-day ROC: -10.19%

Oil/Gold:
  - Component score: 75.0/100
  - Current value: 0.0218
  - Position vs EMA50: ABOVE
  - 20-day ROC: -4.25%
  - 50-day ROC: +73.79%
  → Declining energy demand

SP500/VIX:
  - Component score: 95.0/100
  - Current value: 400.3814
  - Position vs EMA50: ABOVE
  - 20-day ROC: +93.19%
  - 50-day ROC: +20.65%
  → Expanding risk appetite

Commodities/T30y:
  - Component score: 95.0/100
  - Current value: 0.3513
  - Position vs EMA50: ABOVE
  - 20-day ROC: +3.77%
  - 50-day ROC: +31.02%
  → Economic growth expectations

SP500/Nasdaq:
  - Component score: 0.0/100
  - Current value: 0.2894
  - Position vs EMA50: BELOW
  - 20-day ROC: -5.12%
  - 50-day ROC: -4.54%
  - ⚠️ ANOMALY DETECTED - Significant deviation from average

============================================================
CONCLUSIONS AND RECOMMENDATIONS
============================================================

The market is showing broad-based strength signals. Intermarket ratios suggest
a favorable environment for risk-taking. High risk appetite and positive trends.
Positioning: CONSTRUCTIVE on risk assets.


STRONGEST RATIOS:
  • SP500/VIX: 95.0/100
  • Commodities/T30y: 95.0/100
  • Oil/Gold: 75.0/100

WEAKEST RATIOS:
  • DJ/Gold: 65.0/100
  • Gold/USD: 55.0/100
  • SP500/Nasdaq: 0.0/100

============================================================
Analysis automatically generated by kbmeter.com
Date: 2026-04-29
📄 Detailed Asset Allocation Analysis
ASSET ALLOCATION & REGIME ANALYSIS - 2026-04-29
======================================================================

MARKET REGIME: RISK-ON
REGIME SCORE: 75.0/100

======================================================================
TREND AND VOLATILITY ANALYSIS
======================================================================

GLOBAL EQUITIES (ACWI):
  Short-Term Trend (5d): -0.37% | ABOVE EMA 10
  Medium-Term Trend (20d): +8.13% | ABOVE EMA 50
  Long-Term Trend (60d): +2.26% | ABOVE EMA 200

  5d Volatility: 12.0%
  20d Volatility: 17.4%
  60d Volatility: 17.6%

COMMODITIES (DBC):
  Medium-Term Trend (20d): +4.80% | ABOVE EMA 50
  20d Volatility: 21.8%

ACWI/BND Correlation (30d): 0.697

REGIME INTERPRETATION:
The market is in a risk-on regime. Equities are showing positive trends across multiple
time horizons and volatility remains contained. Investors favor risk assets.
Suggested positioning: OVERWEIGHT equities.

======================================================================
ASSET RANKING - WHO IS PERFORMING BEST?
======================================================================

🥇 1. Commodities (DBC) - SCORE: 100/100
     Price: $30.34
     Trend: ABOVE EMA10 | ABOVE EMA50 | ABOVE EMA200
     Performance: 5d +2.81% | 20d +4.80% | 60d +28.89%
     Volatility: 5d 8.3% | 20d 21.8% | 60d 25.2%
     Drawdown: 0.00%
     → Asset in STRONG HEALTH: positive trends and controlled volatility

🥈 2. Global Equities (ACWI) - SCORE: 88/100
     Price: $149.62
     Trend: ABOVE EMA10 | ABOVE EMA50 | ABOVE EMA200
     Performance: 5d -0.37% | 20d +8.13% | 60d +2.26%
     Volatility: 5d 12.0% | 20d 17.4% | 60d 17.6%
     Drawdown: -0.85%
     → Asset in STRONG HEALTH: positive trends and controlled volatility

🥉 3. Global Bonds (BND) - SCORE: 86/100
     Price: $73.72
     Trend: BELOW EMA10 | ABOVE EMA50 | ABOVE EMA200
     Performance: 5d -0.19% | 20d +0.45% | 60d +0.39%
     Volatility: 5d 2.5% | 20d 3.0% | 60d 4.2%
     Drawdown: -1.30%
     → Asset in STRONG HEALTH: positive trends and controlled volatility

======================================================================
CORRELATION ANALYSIS - CURRENT vs HISTORICAL
======================================================================

ACWI/BND:
  Current Correlation (30d): +0.697
  Historical Average (1 year): +0.204
  Deviation: +0.493
  ⚠️ SIGNIFICANT DEVIATION from historical average
  → Positive correlation: diversification IMPAIRED

BND/DBC:
  Current Correlation (30d): -0.419
  Historical Average (1 year): -0.276
  Deviation: -0.143

ACWI/DBC:
  Current Correlation (30d): -0.641
  Historical Average (1 year): -0.017
  Deviation: -0.623
  ⚠️ SIGNIFICANT DEVIATION from historical average
  → Negative correlation: possible supply-driven shift

======================================================================
OPERATIONAL SUMMARY
======================================================================

STRONGEST ASSET: Commodities (Score: 100/100)
WEAKEST ASSET: Global Bonds (Score: 86/100)

SUGGESTED ACTION: Favor the strongest asset, maintain risk exposure.
DIVERSIFICATION: GOOD - Diversification benefits present.

======================================================================
Analysis automatically generated by kbmeter.com
Date: 2026-04-29
Macroeconomic calendar
Today will be especially busy both on the macro front and for U.S. earnings. On the macro side, markets will be watching March inflation data from Australia, the preliminary April 2026 CPI readings for Spain and Germany, Eurozone private-sector confidence, the Bank of Canada’s rate decision, U.S. durable goods orders, and finally the Fed decision in what is expected to be Jerome Powell’s last meeting as Chair.
As for U.S. earnings, four of the Magnificent Seven tech giants report today: Alphabet, Amazon, Meta, and Microsoft. Also notable among the long list of earnings releases are eBay, Adidas, and Qualcomm. Results are also due from major European banks, including UBS, Santander, and Deutsche Bank.
Already a subscriber? Login here
NOTES AND WARNINGS
Data compiled by kbmeter.com. Analysis date: 29 April 2026 - 7:38 AM GMT+1
This content is provided for informational purposes only and should not be considered financial advice. All scores and assessments are based on the previous trading day’s closing prices. Futures indications refer to the date and time of the analysis.