War in Iran Spurs Risk-Off Turn; Equities Slide at Start of March as Gold, Oil Advance
For financial markets, the week — and the month — is shaping up to start on a negative note, as the outbreak of war in Iran adds further uncertainty to an already fragile environment. Sentiment is shifting into risk-off mode, driving purchases of gold and fueling a defensive rotation. The focus is now on the duration of the conflict, the key factor in assessing the potential impact on the global economy in the coming months. Futures point to a lower opening for both Europe and the United States.
Market Weather Map
March 2, 2026
US Equities
Eu Equities
Asia Equities
Commodities
Bonds
Dollar Index
Technology
Gold
Oil
Crypto
Market Summary
How to interpret our financial indicators? Find out here.
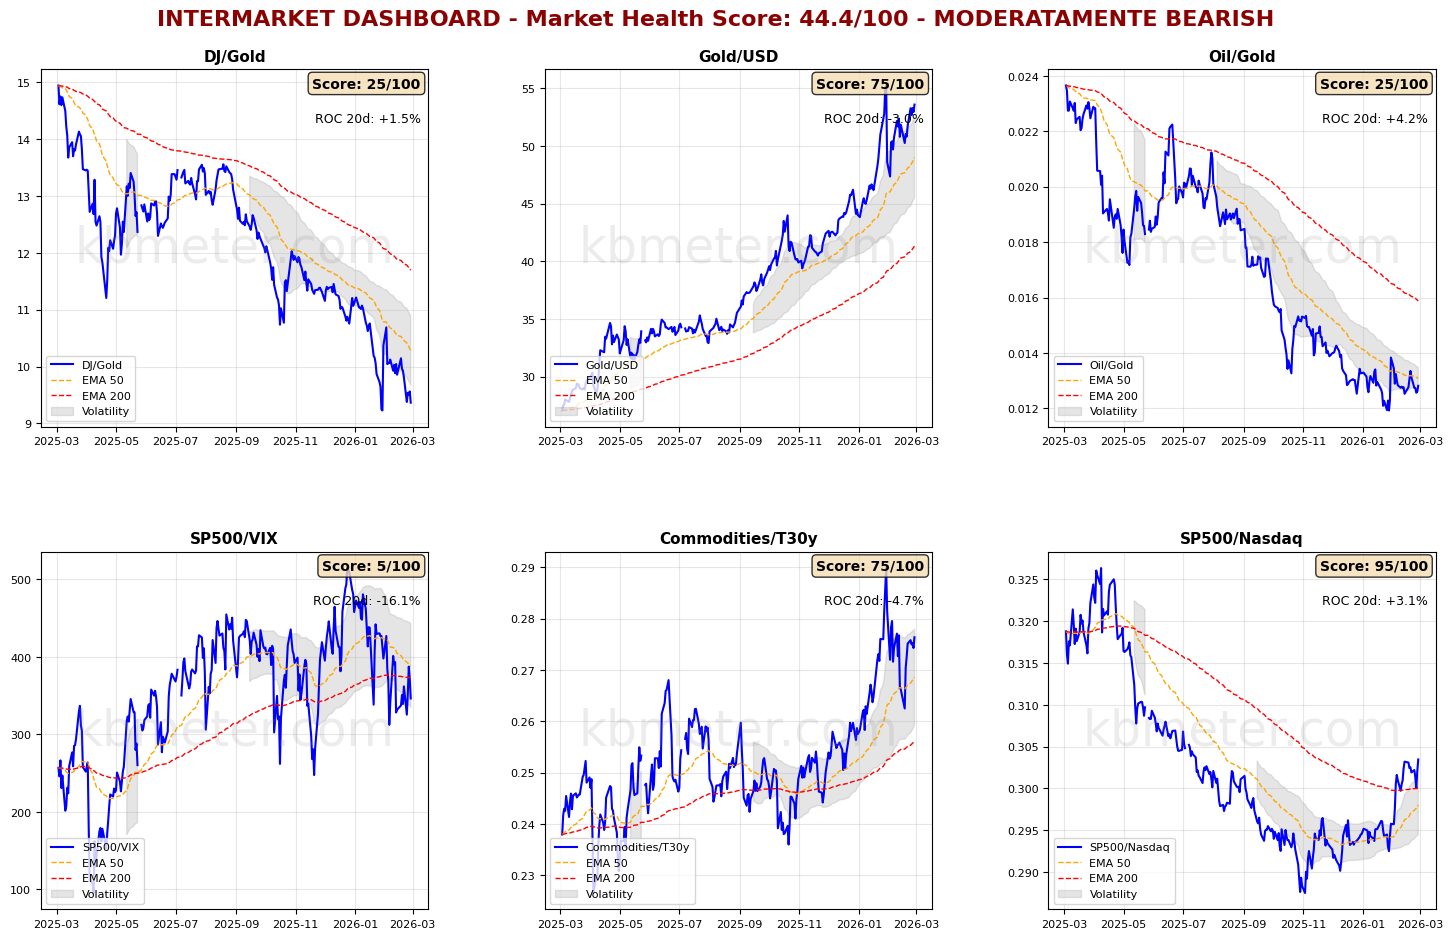
Financial markets are currently showing a moderately negative sentiment. Intermarket analysis highlights a Market Health Score of 44/100 (moderately negative). Our intermarket dashboards — updated with data from last Friday — only partially capture the effects of the rapidly deteriorating situation in the Middle East. Risk indicators are worsening again, and in the rally of gold and oil, it is oil that is showing stronger signs of acceleration.
Volatility remains elevated, and our directional scores (the arrows in the weather map above) confirm the strong focus on gold and oil. The effects of this situation are visible in the charts of the main asset classes, where commodities are accelerating higher once again.
Pre-Opening Futures: Global futures indicate a risk-off sentiment (average -0.88%), with the US sharply negative (-1.02%), Europe negative (-0.81%), and Asia negative (-0.89%).
📊 Global Futures – Pre-Opening Sentiment
- TecDAX derived: +1.14%
- Mini MDAX derived: +0.00%
- CSI 300: -0.03%
- DAX derived: -1.61%
- Mini DAX: -1.55%
- Nikkei 225 derived: -1.54%
📄 Detailed Intermarket Analysis
INTERMARKET ANALYSIS - 2026-03-02
============================================================

MARKET HEALTH SCORE: 44.4/100
SENTIMENT: MODERATELY BEARISH

============================================================
SUMMARY OF MAIN RATIOS
============================================================


DJ/Gold:
  - Component score: 25.0/100
  - Current value: 9.3639
  - Position vs EMA50: BELOW
  - 20-day ROC: +1.49%
  - 50-day ROC: -16.71%
  → Flight to safe haven

Gold/USD:
  - Component score: 75.0/100
  - Current value: 53.5857
  - Position vs EMA50: ABOVE
  - 20-day ROC: -2.99%
  - 50-day ROC: +22.12%

Oil/Gold:
  - Component score: 25.0/100
  - Current value: 0.0128
  - Position vs EMA50: BELOW
  - 20-day ROC: +4.17%
  - 50-day ROC: -2.88%
  → Rising energy demand

SP500/VIX:
  - Component score: 5.0/100
  - Current value: 346.3686
  - Position vs EMA50: BELOW
  - 20-day ROC: -16.10%
  - 50-day ROC: -16.16%
  → Contracting risk appetite

Commodities/T30y:
  - Component score: 75.0/100
  - Current value: 0.2764
  - Position vs EMA50: ABOVE
  - 20-day ROC: -4.65%
  - 50-day ROC: +8.62%
  → Economic growth expectations

SP500/Nasdaq:
  - Component score: 95.0/100
  - Current value: 0.3035
  - Position vs EMA50: ABOVE
  - 20-day ROC: +3.13%
  - 50-day ROC: +2.65%

============================================================
CONCLUSIONS AND RECOMMENDATIONS
============================================================

The market shows signs of weakness. Several ratios are in negative territory.
Risk appetite declining. Increase caution.
Positioning: DEFENSIVE, favor safe havens.


STRONGEST RATIOS:
  • SP500/Nasdaq: 95.0/100
  • Gold/USD: 75.0/100
  • Commodities/T30y: 75.0/100

WEAKEST RATIOS:
  • DJ/Gold: 25.0/100
  • Oil/Gold: 25.0/100
  • SP500/VIX: 5.0/100

============================================================
Analysis automatically generated by kbmeter.com
Date: 2026-03-02
📄 Detailed Asset Allocation Analysis
ASSET ALLOCATION & REGIME ANALYSIS - 2026-03-02
======================================================================
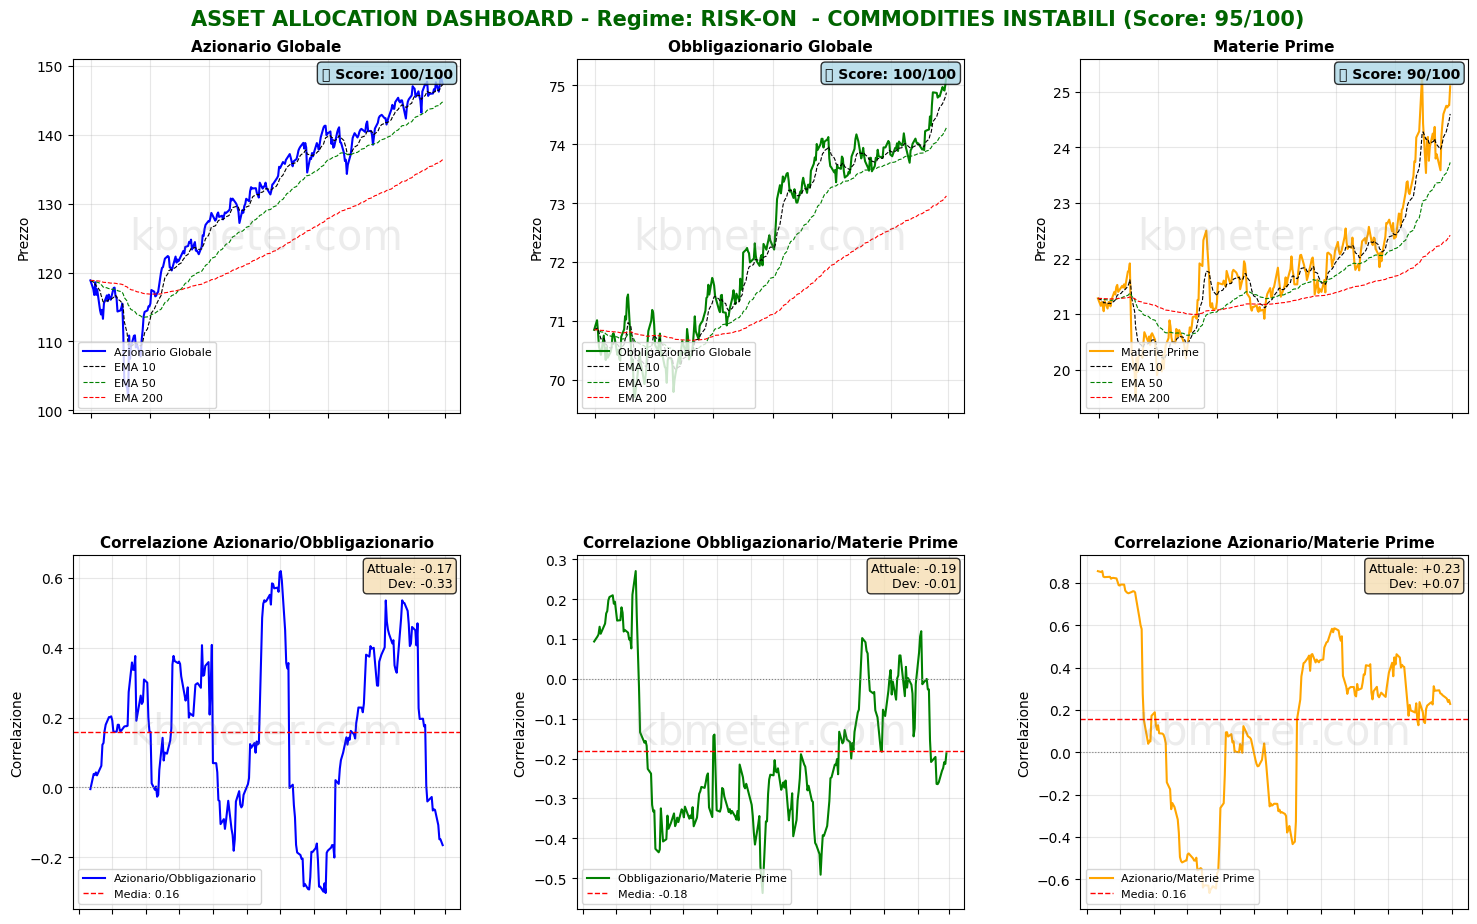
MARKET REGIME: RISK-ON - UNSTABLE COMMODITIES
REGIME SCORE: 95.0/100
======================================================================
TREND AND VOLATILITY ANALYSIS
======================================================================
GLOBAL EQUITIES (ACWI):
Short-Term Trend (5d): +0.77% | ABOVE EMA 10
Medium-Term Trend (20d): +1.29% | ABOVE EMA 50
Long-Term Trend (60d): +5.33% | ABOVE EMA 200
Volatility 5d: 12.7%
Volatility 20d: 13.5%
Volatility 60d: 10.8%
COMMODITIES (DBC):
Medium-Term Trend (20d): +2.74% | ABOVE EMA 50
Volatility 20d: 27.2%
ACWI/BND Correlation (30d): -0.165
REGIME INTERPRETATION:
The market is in a risk-on regime. Equities show positive trends across multiple
time horizons and volatility remains contained. Investors favor risk assets.
Suggested positioning: OVERWEIGHT equities.
⚠️ COMMODITIES ALERT: Commodities show elevated volatility. This may
indicate uncertainty about economic growth or unstable supply/demand dynamics.
======================================================================
ASSET RANKING - WHO IS PERFORMING BEST?
======================================================================
🥇 1. Global Equities (ACWI) - SCORE: 100/100
Price: $147.38
Trend: ABOVE EMA10 | ABOVE EMA50 | ABOVE EMA200
Performance: 5d +0.77% | 20d +1.29% | 60d +5.33%
Volatility: 5d 12.7% | 20d 13.5% | 60d 10.8%
Drawdown: -0.85%
→ Asset in STRONG HEALTH: positive trends and controlled volatility
🥈 2. Global Bonds (BND) - SCORE: 100/100
Price: $75.17
Trend: ABOVE EMA10 | ABOVE EMA50 | ABOVE EMA200
Performance: 5d +0.27% | 20d +1.60% | 60d +1.82%
Volatility: 5d 2.0% | 20d 2.9% | 60d 2.7%
Drawdown: 0.00%
→ Asset in STRONG HEALTH: positive trends and controlled volatility
🥉 3. Commodities (DBC) - SCORE: 90/100
Price: $25.10
Trend: ABOVE EMA10 | ABOVE EMA50 | ABOVE EMA200
Performance: 5d +1.41% | 20d +2.74% | 60d +12.71%
Volatility: 5d 9.6% | 20d 27.2% | 60d 19.4%
Drawdown: -0.79%
→ Asset in STRONG HEALTH: positive trends and controlled volatility
======================================================================
CORRELATION ANALYSIS - CURRENT vs HISTORICAL
======================================================================
ACWI/BND:
Current correlation (30d): -0.165
Historical average (1 year): +0.160
Deviation: -0.325
⚠️ SIGNIFICANT DEVIATION from historical average
→ Weak correlation: moderate diversification
BND/DBC:
Current correlation (30d): -0.187
Historical average (1 year): -0.180
Deviation: -0.007
ACWI/DBC:
Current correlation (30d): +0.228
Historical average (1 year): +0.156
Deviation: +0.072
======================================================================
OPERATIONAL SUMMARY
======================================================================
STRONGEST ASSET: Global Equities (Score: 100/100)
WEAKEST ASSET: Commodities (Score: 90/100)
SUGGESTED ACTION: Favor the strongest asset, maintain risk exposure.
DIVERSIFICATION: EXCELLENT - Asset classes are moving independently.
======================================================================
Analysis automatically generated by kbmeter.com
Date: 2026-03-02
On the macro front, today’s agenda includes the final reading of February PMI surveys, Germany’s January retail sales data, and the February update of the ISM manufacturing survey.
Already a subscriber? Login here
NOTES AND WARNINGS
Analysis automatically generated by kbmeter.com. Analysis date: 2 March 2026 - 7:18 AM GMT+1
This content is provided for informational purposes only and should not be considered financial advice. All scores and assessments are based on the previous trading day’s closing prices. Futures indications refer to the date and time of the analysis.