US Jobs Data, Tariff Setback and Middle East Tensions Drive Markets Into Week-End Close
Financial markets are heading toward the close of the week alongside three extremely significant market movers: the April 2026 U.S. employment report, the ruling on Trump’s new tariffs, and the evolving U.S.-Iran situation. These are forces that, if aligned, could provide clear direction to the markets — or, conversely, increase uncertainty.
For the moment, investors remain positioned in a risk-on environment, although caution is increasing and volatility remains elevated. Futures point to a positive opening for the United States, while Europe is expected to open slightly below parity.
Market Weather Map
May 8, 2026
US Equities
Eu Equities
Asia Equities
Commodities
Bonds
Dollar Index
Technology
Gold
Oil
Crypto
Market Summary
Il sentiment sui mercati finanziari
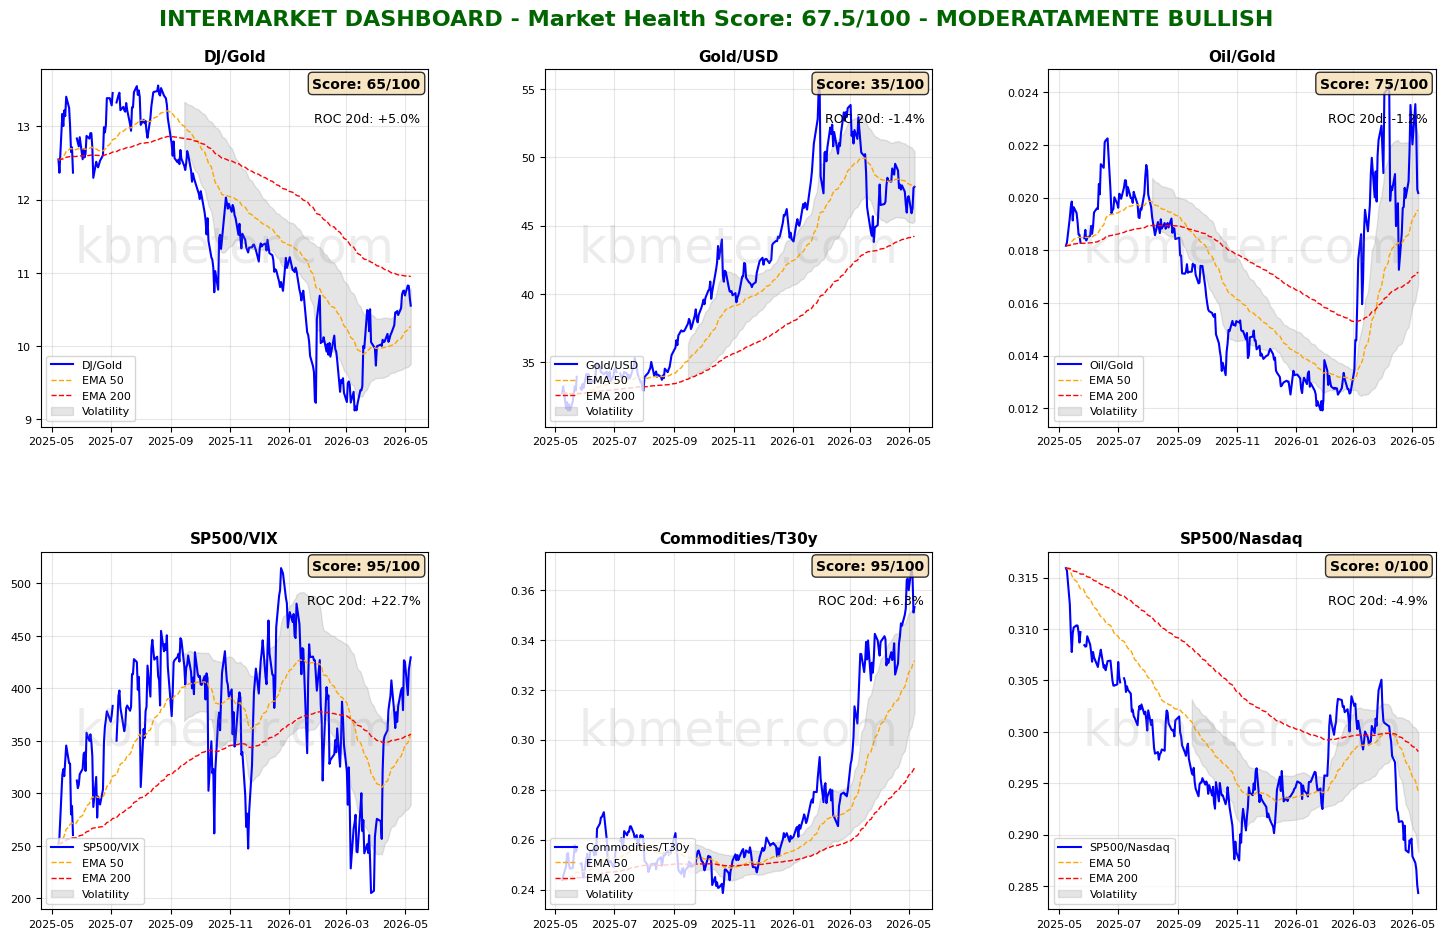
Financial markets are currently showing a neutral to moderately positive sentiment. Intermarket analysis highlights a Market Health Score of 68/100 (positive). Our intermarket dashboards confirm what emerged in previous analyses: markets continue to show a predominance of risk-on positioning, driven mainly by the strong performance of the technology sector. Developments in the Middle East are making the relationship between Gold and Oil increasingly volatile, while inflation expectations continue to keep the Commodities / 30-year Treasury ratio near the highs of the current period.
Regarding asset classes, it is worth noting that news coming from the Middle East is now having a direct impact on fixed income markets, while equities appear to be slightly more insulated from news-driven movements.
Global Futures – Pre-Market Sentiment
Pre-Market Futures: Global futures indicate a moderate risk-off sentiment (-0.24% on average), with the U.S. slightly positive (+0.21%), Europe negative (-0.62%), and Asia slightly positive (+0.32%).
📊 Global Futures – Pre-Market Sentiment
- Nikkei 225 derived: +0.70%
- CSI 300: +0.46%
- US Tech 100 derived: +0.39%
- FTSE MIB derived: -2.12%
- IBEX 35 derived: -1.06%
- Mini DAX: -0.88%
Intermarket details
📄 Detailed Intermarket Analysis
INTERMARKET ANALYSIS - 2026-05-08
============================================================

MARKET HEALTH SCORE: 67.5/100
SENTIMENT: MODERATELY BULLISH

============================================================
SUMMARY OF MAIN RATIOS
============================================================


DJ/Gold:
  - Component score: 65.0/100
  - Current value: 10.5530
  - Position vs EMA50: ABOVE
  - 20-day ROC: +4.95%
  - 50-day ROC: +11.04%
  → Preference for risky assets vs safe havens

Gold/USD:
  - Component score: 35.0/100
  - Current value: 47.8351
  - Position vs EMA50: BELOW
  - 20-day ROC: -1.36%
  - 50-day ROC: -10.24%

Oil/Gold:
  - Component score: 75.0/100
  - Current value: 0.0202
  - Position vs EMA50: ABOVE
  - 20-day ROC: -1.22%
  - 50-day ROC: +60.55%
  → Declining energy demand

SP500/VIX:
  - Component score: 95.0/100
  - Current value: 429.5732
  - Position vs EMA50: ABOVE
  - 20-day ROC: +22.68%
  - 50-day ROC: +10.89%
  → Expanding risk appetite

Commodities/T30y:
  - Component score: 95.0/100
  - Current value: 0.3532
  - Position vs EMA50: ABOVE
  - 20-day ROC: +6.26%
  - 50-day ROC: +26.90%
  → Economic growth expectations

SP500/Nasdaq:
  - Component score: 0.0/100
  - Current value: 0.2843
  - Position vs EMA50: BELOW
  - 20-day ROC: -4.92%
  - 50-day ROC: -5.23%
  - ⚠️ ANOMALY DETECTED - Significant deviation from the average

============================================================
CONCLUSIONS AND RECOMMENDATIONS
============================================================

The market remains moderately constructive. Some ratios are showing positive signals,
but cautionary elements persist. Monitor developments closely.
Positioning: SELECTIVE, favor quality.


STRONGEST RATIOS:
  • SP500/VIX: 95.0/100
  • Commodities/T30y: 95.0/100
  • Oil/Gold: 75.0/100

WEAKEST RATIOS:
  • DJ/Gold: 65.0/100
  • Gold/USD: 35.0/100
  • SP500/Nasdaq: 0.0/100

============================================================
Data processed by kbmeter.com
Date: 2026-05-08
📄 Detailed Asset Allocation Analysis
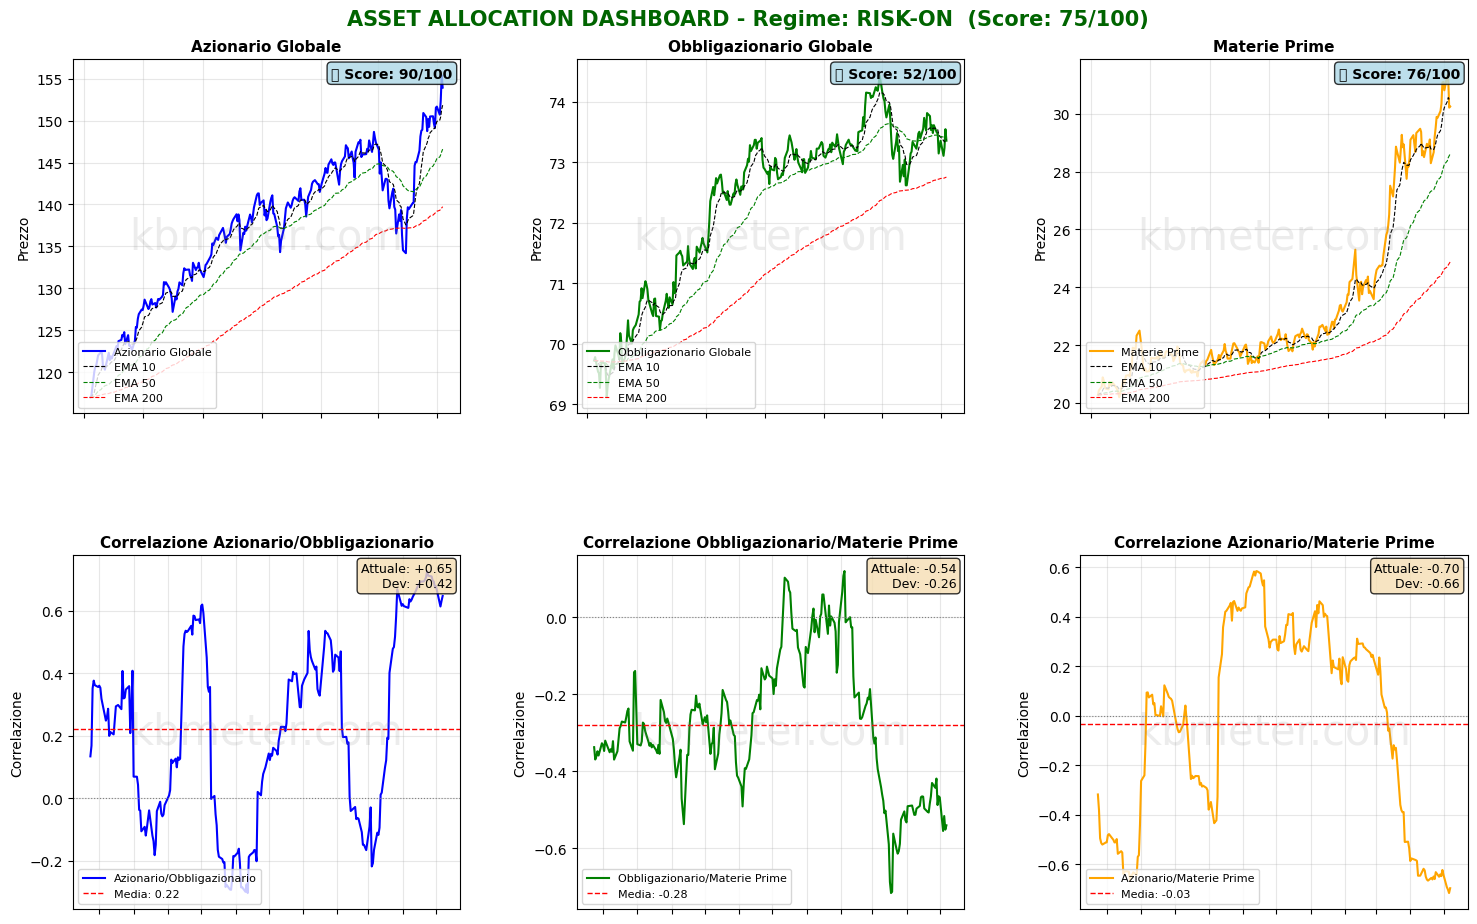
ASSET ALLOCATION & REGIME ANALYSIS - 2026-05-08
======================================================================

MARKET REGIME: RISK-ON
REGIME SCORE: 75.0/100

======================================================================
TREND AND VOLATILITY ANALYSIS
======================================================================

GLOBAL EQUITIES (ACWI):
  Short-Term Trend (5d): +1.50% | ABOVE EMA 10
  Medium-Term Trend (20d): +6.13% | ABOVE EMA 50
  Long-Term Trend (60d): +4.21% | ABOVE EMA 200

  5d Volatility: 19.4%
  20d Volatility: 14.3%
  60d Volatility: 17.8%

COMMODITIES (DBC):
  Medium-Term Trend (20d): +6.14% | ABOVE EMA 50
  20d Volatility: 22.9%

ACWI/BND Correlation (30d): 0.648

REGIME INTERPRETATION:
The market is currently in a risk-on regime. Equities are showing positive trends across multiple
time horizons and volatility remains contained. Investors continue to favor risky assets.
Suggested positioning: OVERWEIGHT equities.

======================================================================
ASSET RANKING - TOP PERFORMERS
======================================================================

🥇 1. Global Equities (ACWI) - SCORE: 90/100
     Price: $153.93
     Trend: ABOVE EMA10 | ABOVE EMA50 | ABOVE EMA200
     Performance: 5d +1.50% | 20d +6.13% | 60d +4.21%
     Volatility: 5d 19.4% | 20d 14.3% | 60d 17.8%
     Drawdown: -0.95%
     → Asset in STRONG HEALTH: positive trends and controlled volatility

🥈 2. Commodities (DBC) - SCORE: 76/100
     Price: $30.25
     Trend: BELOW EMA10 | ABOVE EMA50 | ABOVE EMA200
     Performance: 5d -1.82% | 20d +6.14% | 60d +24.13%
     Volatility: 5d 28.1% | 20d 22.9% | 60d 24.7%
     Drawdown: -3.45%
     → Asset in STRONG HEALTH: positive trends and controlled volatility

🥉 3. Global Bonds (BND) - SCORE: 52/100
     Price: $73.36
     Trend: BELOW EMA10 | BELOW EMA50 | ABOVE EMA200
     Performance: 5d +0.00% | 20d -0.05% | 60d -0.33%
     Volatility: 5d 5.1% | 20d 3.9% | 60d 4.4%
     Drawdown: -1.45%
     → Asset in NEUTRAL condition: mixed signals

======================================================================
CORRELATION ANALYSIS - CURRENT vs HISTORICAL
======================================================================

ACWI/BND:
  Current Correlation (30d): +0.648
  Historical Average (1 year): +0.223
  Deviation: +0.425
  ⚠️ SIGNIFICANT DEVIATION from historical average
  → Positive correlation: diversification COMPROMISED

BND/DBC:
  Current Correlation (30d): -0.540
  Historical Average (1 year): -0.281
  Deviation: -0.259

ACWI/DBC:
  Current Correlation (30d): -0.696
  Historical Average (1 year): -0.034
  Deviation: -0.662
  ⚠️ SIGNIFICANT DEVIATION from historical average
  → Negative correlation: possible supply-driven shift

======================================================================
OPERATIONAL SUMMARY
======================================================================

STRONGEST ASSET: Global Equities (Score: 90/100)
WEAKEST ASSET: Global Bonds (Score: 52/100)

SUGGESTED ACTION: Favor the strongest asset while maintaining risk exposure.
DIVERSIFICATION: WEAK - Asset classes tend to move together.

======================================================================
Data processed by kbmeter.com
Date: 2026-05-08
Macroeconomic Calendar
On the macro front, today’s focus revolves around U.S. labor market data for April 2026. Also important are Germany’s March 2026 export figures, Canada’s employment situation, and the preliminary reading of the University of Michigan consumer sentiment index. As for earnings reports, Toyota’s results are among the key releases to watch.
Already a subscriber? Login here
NOTES AND WARNINGS
Data compiled by kbmeter.com. Analysis date: 8 May 2026 - 7:41 AM GMT+1
This content is provided for informational purposes only and should not be considered financial advice. All scores and assessments are based on the previous trading day’s closing prices. Futures indications refer to the date and time of the analysis.