
US-Iran Tensions Lift Oil, Drive Bond Yields Higher
A cold shower for financial markets. The announcement of the end of the ceasefire between the US and Iran, together with renewed threats to close the Strait of Hormuz, has reignited oil prices and, with them, fears of a fresh wave of inflation. (Fed minutes did little to reassure investors, revealing a divided Board over the future path of interest rates.) Crude oil surged by more than 10 score points in a single session, pushing government bond yields higher. Gold’s tentative recovery faltered, while the US dollar remained broadly stable. Equities—already grappling with volatility in the technology sector—came under pressure, particularly in Europe and Asia. Investor sentiment remains neutral. Futures point to a weaker opening in Europe and a flat start in the United States.
Market Weather Map
July 9, 2026
US Equities
Eu Equities
Asia Equities
Commodities
Bonds
Dollar Index
Technology
Gold
Oil
Crypto
Market Summary
Do you want to see the score details for all assets monitored by KBMeter?
Try free for 14 days →Financial markets sentiment
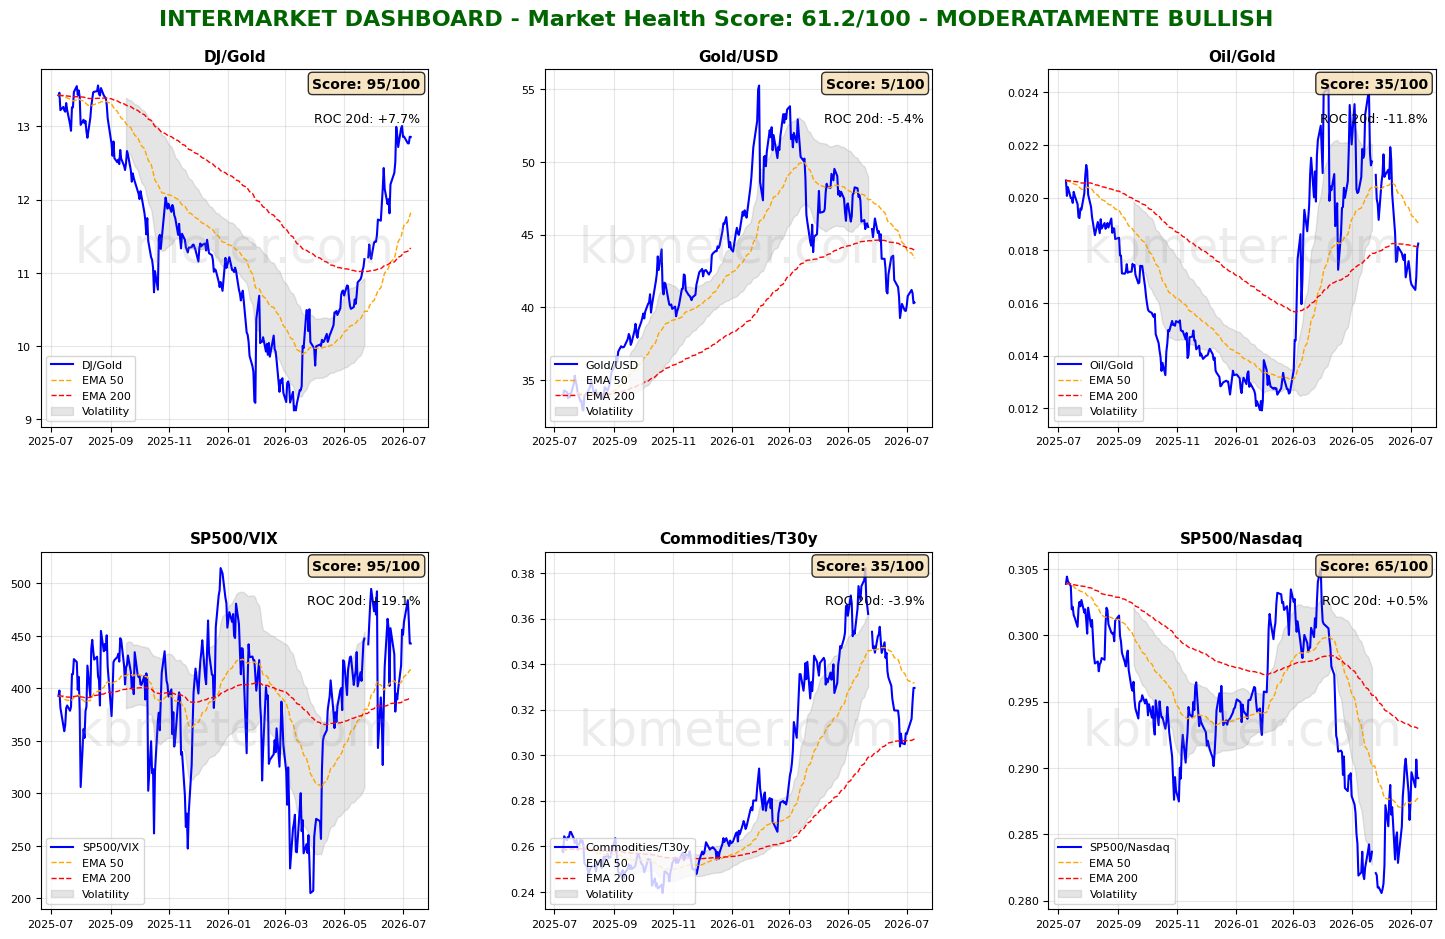
Financial markets currently display a neutral sentiment. Our intermarket analysis shows a Market Health Score of 61/100, indicating moderately positive market conditions. Our intermarket dashboards highlight the impact of the renewed tensions in the Gulf. The Commodities/Bonds ratio has strengthened its rebound from the long-term moving average and has now reached the 50-day moving average area, while the Oil/Gold ratio has climbed back above its long-term moving average. Beyond the main market driver, the technology sector continues to show weakness, although underlying market sentiment is still attempting to remain constructive. Gold’s modest recovery against the US dollar is also holding up for the time being.
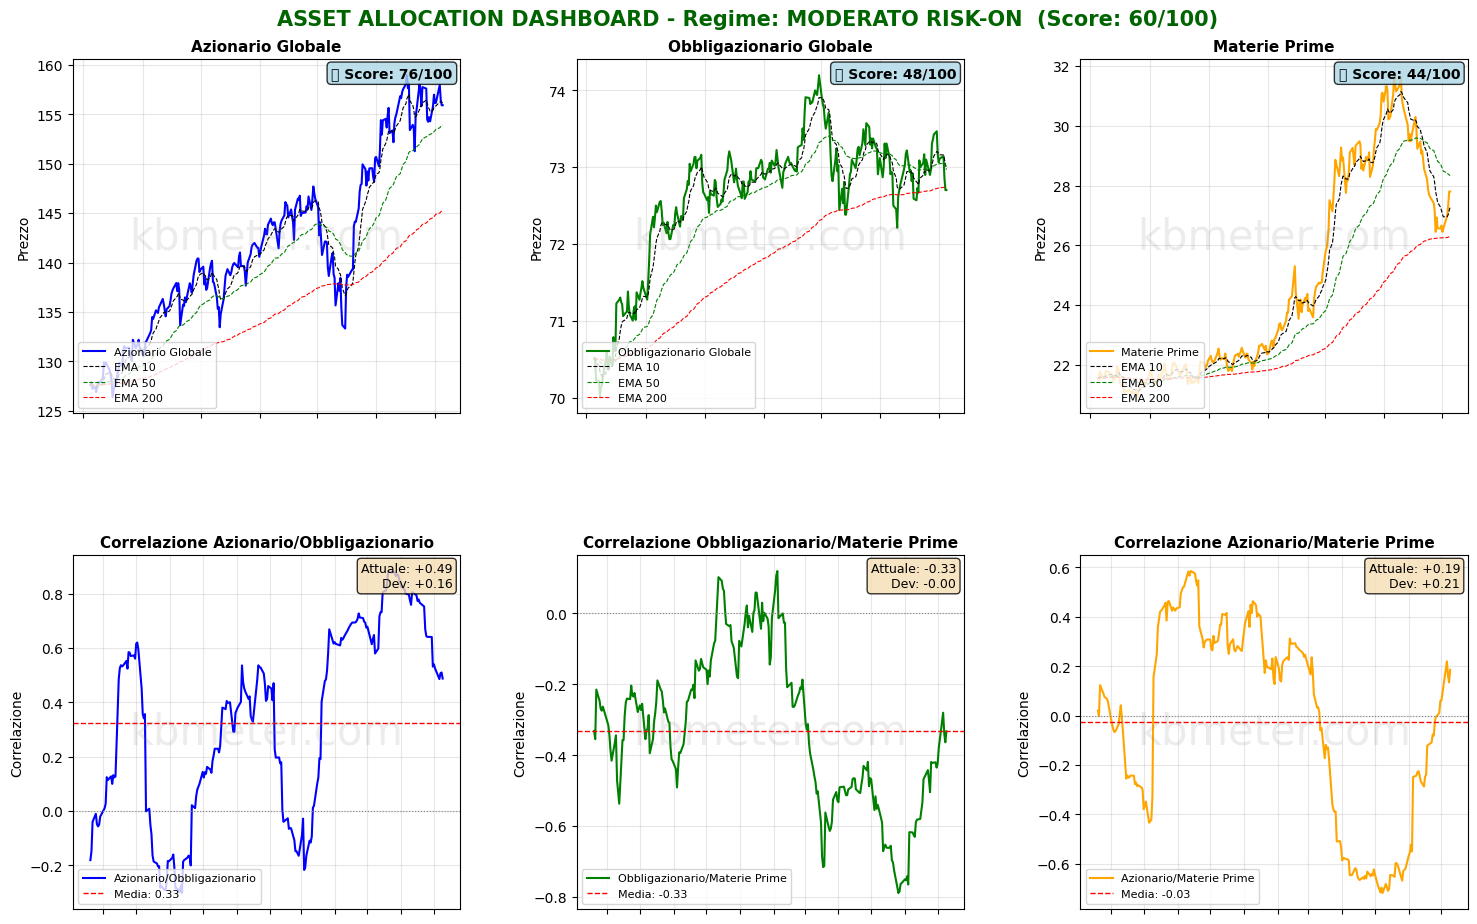
Across asset classes, market moves have been significant. Global equities remain afloat, although momentum is slowing. Global bonds have slipped back below their long-term moving average following the sudden spike in oil prices, while commodities continue to strengthen their rebound from long-term moving average support.
Our Financial Markets Weather Map clearly illustrates the speed and magnitude of the market reaction to President Trump’s announcement that the ceasefire with Iran had come to an end. Oil jumped by more than 10 score points in a single session, while the Energy sector gained 9 points. Equities remain above the 50-point threshold but have weakened overall, with Europe—the region most exposed to oil price volatility—losing more than three points. Fixed income markets have come under pressure from renewed inflation concerns, with the Health Score for 30-year US Treasury yields rising by more than seven points in just one session.
Cryptocurrencies also deserve attention. Their score has returned to neutral territory, driven almost entirely by the Outlook component. While this may represent an early sign of stabilization, it should still be interpreted with considerable caution.
Global Futures – Pre-Market Sentiment
Pre-Market Futures: Global futures indicate a moderately risk-off tone (average -0.37%), with US futures slightly positive (+0.17%), European futures negative (-0.79%), and Asian futures modestly higher (+0.15%).
📊 Global Futures – Pre-Market Sentiment
- Euro Stoxx 50 derived: +0.92%
- DAX derived: +0.74%
- Mini DAX: +0.65%
- TecDAX derived: -5.93%
- IBEX 35 derived: -2.75%
- FTSE MIB derived: -1.25%
Macroeconomic calendar
On the macroeconomic front, today’s calendar includes China’s June 2026 inflation data, Germany’s May 2026 trade balance update, US weekly initial jobless claims, and US June 2026 existing home sales. Investors will also focus on the release of the minutes from the European Central Bank’s latest policy meeting.
Already a subscriber? Login here
NOTES AND WARNINGS
Data compiled by kbmeter.com. Analysis date: 9 July 2026 - 7:39 AM GMT+1
This content is provided for informational purposes only and should not be considered financial advice. All scores and assessments are based on the previous trading day’s closing prices. Futures indications refer to the date and time of the analysis.
