The Middle East Conflict Weighs on Financial Markets. In a Moderate Risk-Off Climate, Investors Focus on Energy and Inflation Risks
The conflict in the Middle East is impacting financial markets, but the reaction remains overall contained and orderly. Investors are closely monitoring energy prices, a potential source of new inflationary risks for the global economy. Sentiment remains moderately risk-off. On the macro front, attention is focused on inflation data in the Euro area, especially after the mixed signals from Spain, France, and Germany. Futures point to another weak opening for both Europe and the United States.
Market Weather Map
March 3, 2026
US Equities
Eu Equities
Asia Equities
Commodities
Bonds
Dollar Index
Technology
Gold
Oil
Crypto
Market Summary
How to interpret our financial indicators? Find out here.
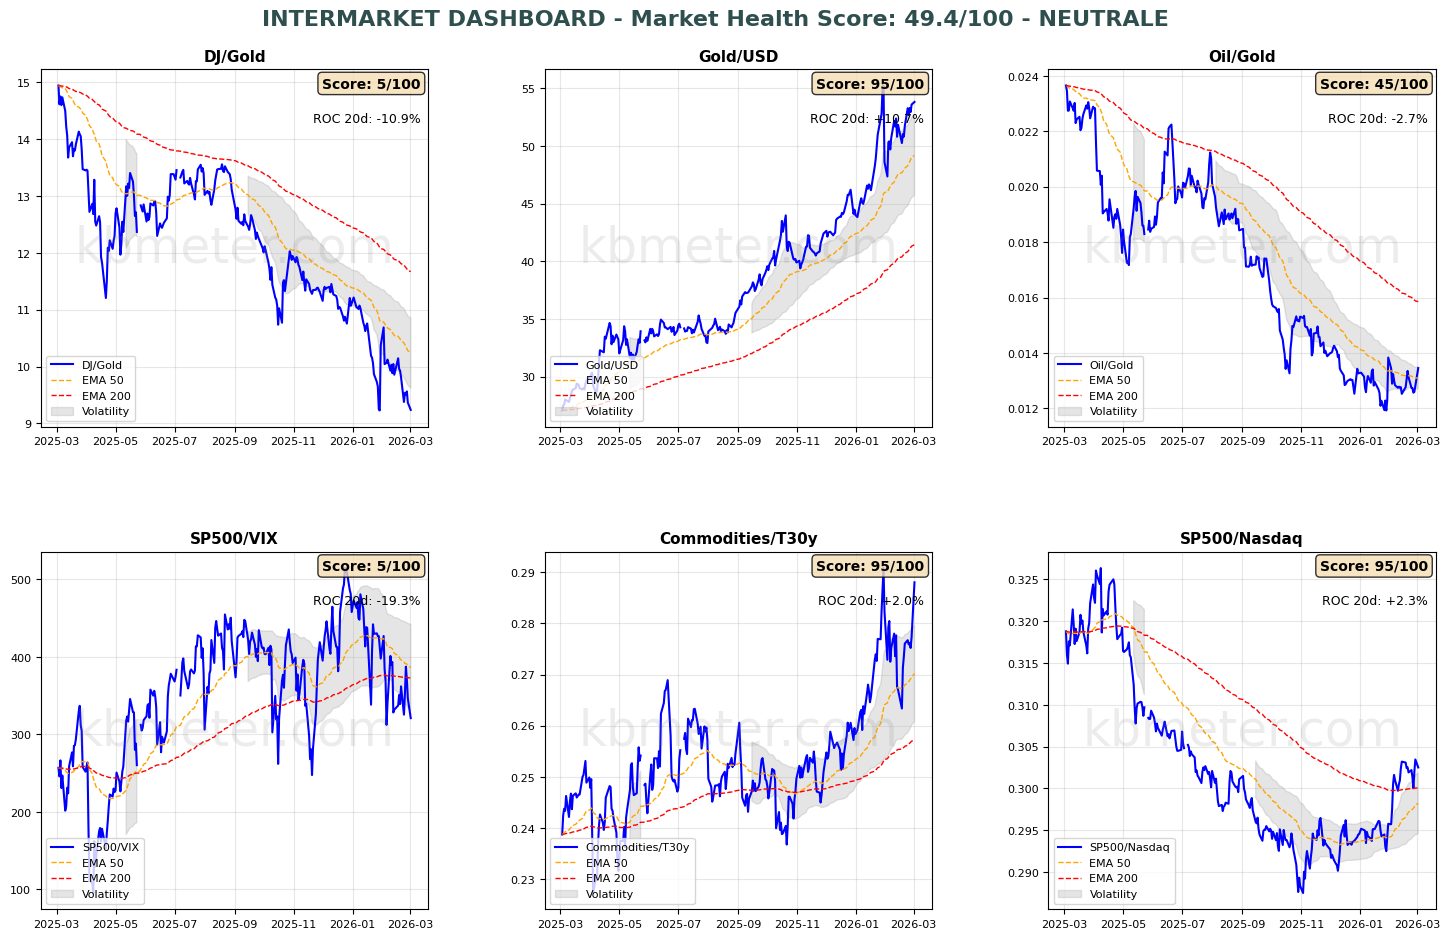
Financial markets are showing a neutral to moderately negative sentiment today. Intermarket analysis highlights a Market Health Score of 49/100 (neutral). Our intermarket dashboards reveal two interesting aspects. Risk indicators remain at elevated levels of uncertainty but show no significant deviations compared to recent days—another sign that the conflict in the Middle East is being managed without panic and, as noted yesterday, in a relatively orderly manner. The other key aspect concerns the leading asset in this phase, namely oil. Its ratio to gold—still in good shape—has risen back to January levels and moved above the 50-day moving average. No major signals are emerging yet from asset class analysis; a slowdown is visible in equities and bonds (with inflation expectations prevailing), while the commodities sector remains highly volatile.
Pre-Opening Futures: Global futures indicate a risk-off sentiment (average -1.13%), with the U.S. negative (-0.96%), Europe sharply negative (-1.17%), and Asia sharply negative (-1.24%).
📊 Global Futures – Pre-Opening Sentiment
- CSI 300: +0.09%
- Mini MDAX derived: +0.00%
- FTSE 100 derived: -0.73%
- Nikkei 225 derived: -2.50%
- TecDAX derived: -2.02%
- FTSE MIB derived: -2.01%
📄 Detailed Intermarket Analysis
INTERMARKET ANALYSIS - 2026-03-03
============================================================

MARKET HEALTH SCORE: 49.4/100
SENTIMENT: NEUTRAL

============================================================
SUMMARY OF MAIN RATIOS
============================================================


DJ/Gold:
  - Component score: 5.0/100
  - Current value: 9.2371
  - Position vs EMA50: BELOW
  - 20-day ROC: -10.94%
  - 50-day ROC: -17.36%
  → Flight to safe haven

Gold/USD:
  - Component score: 95.0/100
  - Current value: 53.8158
  - Position vs EMA50: ABOVE
  - 20-day ROC: +10.73%
  - 50-day ROC: +22.71%

Oil/Gold:
  - Component score: 45.0/100
  - Current value: 0.0135
  - Position vs EMA50: ABOVE
  - 20-day ROC: -2.74%
  - 50-day ROC: +4.78%
  → Declining energy demand

SP500/VIX:
  - Component score: 5.0/100
  - Current value: 320.9711
  - Position vs EMA50: BELOW
  - 20-day ROC: -19.33%
  - 50-day ROC: -22.21%
  → Contracting risk appetite

Commodities/T30y:
  - Component score: 95.0/100
  - Current value: 0.2880
  - Position vs EMA50: ABOVE
  - 20-day ROC: +1.99%
  - 50-day ROC: +14.60%
  → Economic growth expectations

SP500/Nasdaq:
  - Component score: 95.0/100
  - Current value: 0.3025
  - Position vs EMA50: ABOVE
  - 20-day ROC: +2.28%
  - 50-day ROC: +2.81%

============================================================
CONCLUSIONS AND RECOMMENDATIONS
============================================================

The market is in a neutral/sideways phase. Conflicting signals across the various ratios.
There is no clear directional bias. Wait for confirmation.
Positioning: BALANCED, avoid excesses.


STRONGEST RATIOS:
  • Gold/USD: 95.0/100
  • Commodities/T30y: 95.0/100
  • SP500/Nasdaq: 95.0/100

WEAKEST RATIOS:
  • Oil/Gold: 45.0/100
  • DJ/Gold: 5.0/100
  • SP500/VIX: 5.0/100

============================================================
Analysis automatically generated by kbmeter.com
Date: 2026-03-03
📄 Detailed Asset Allocation Analysis
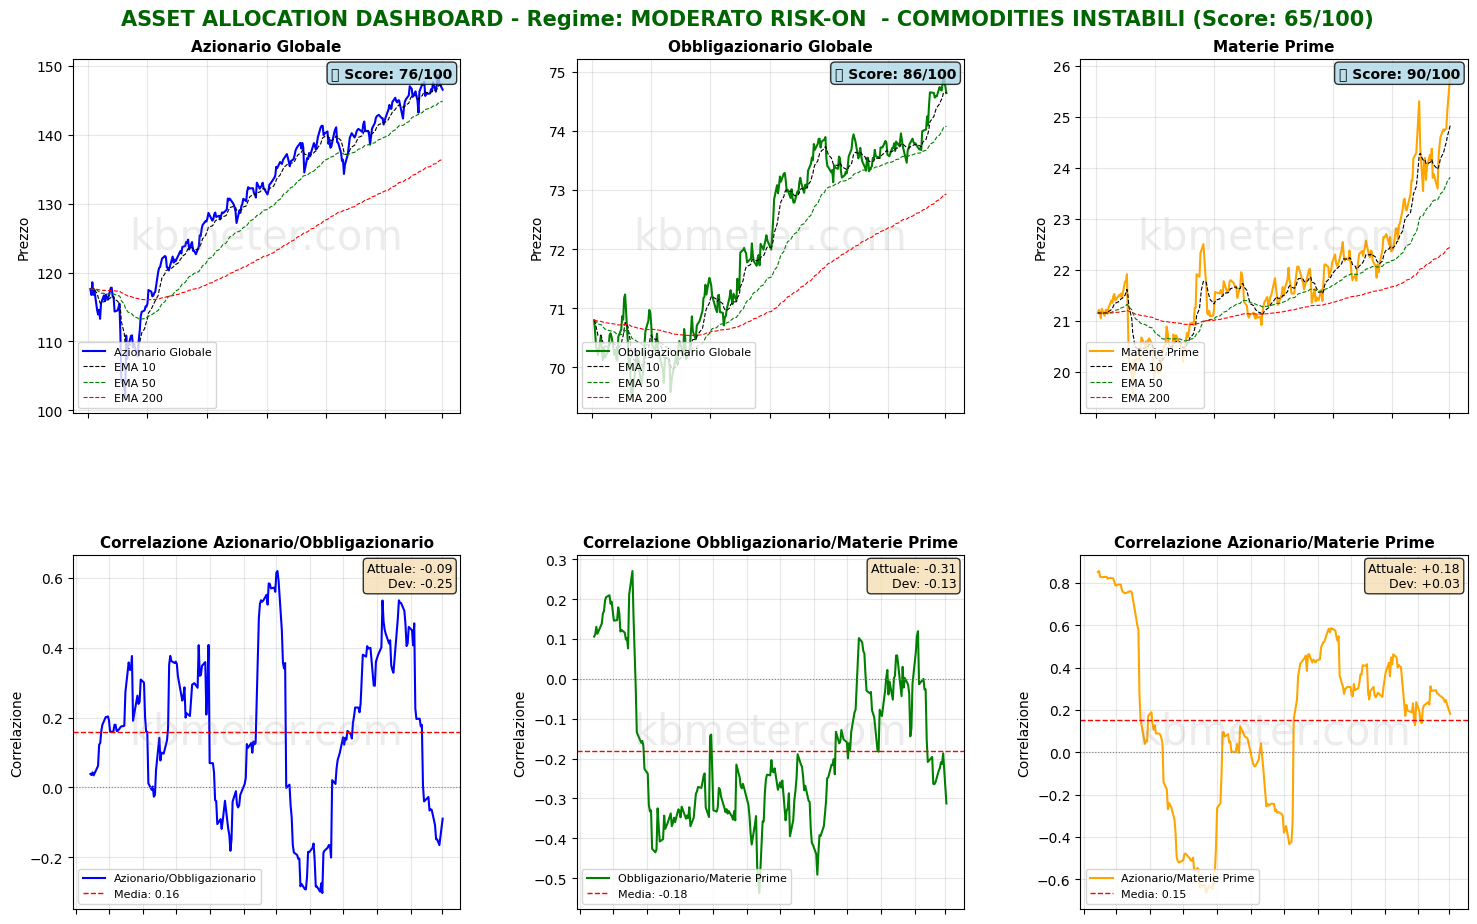
ASSET ALLOCATION & REGIME ANALYSIS - 2026-03-03
======================================================================

MARKET REGIME: MODERATE RISK-ON  - UNSTABLE COMMODITIES
REGIME SCORE: 65.0/100

======================================================================
TREND AND VOLATILITY ANALYSIS
======================================================================

GLOBAL EQUITIES (ACWI):
  Short-Term Trend (5d): -0.53% | BELOW EMA 10
  Medium-Term Trend (20d): +0.16% | ABOVE EMA 50
  Long-Term Trend (60d): +4.35% | ABOVE EMA 200

  Volatility 5d: 11.3%
  Volatility 20d: 13.3%
  Volatility 60d: 10.9%

COMMODITIES (DBC):
  Medium-Term Trend (20d): +9.64% | ABOVE EMA 50
  Volatility 20d: 25.8%

ACWI/BND Correlation (30d): -0.089

REGIME INTERPRETATION:
The market shows a risk-on bias but with some elements of caution.
The trend is constructive, though conflicting signals may appear across certain time horizons.
Suggested positioning: BALANCED with a slight tilt toward risk assets.

⚠️ COMMODITIES ALERT: Commodities are showing elevated volatility. This may
indicate uncertainty about economic growth or unstable supply/demand dynamics.

======================================================================
ASSET RANKING - WHO IS PERFORMING BEST?
======================================================================

🥇 1. Commodities (DBC) - SCORE: 90/100
     Price: $25.81
     Trend: ABOVE EMA10 | ABOVE EMA50 | ABOVE EMA200
     Performance: 5d +4.41% | 20d +9.64% | 60d +15.34%
     Volatility: 5d 20.0% | 20d 25.8% | 60d 20.1%
     Drawdown: 0.00%
     → Asset in STRONG HEALTH: positive trends and controlled volatility

🥈 2. Global Bonds (BND) - SCORE: 86/100
     Price: $74.64
     Trend: BELOW EMA10 | ABOVE EMA50 | ABOVE EMA200
     Performance: 5d -0.08% | 20d +1.29% | 60d +1.26%
     Volatility: 5d 3.8% | 20d 3.3% | 60d 2.9%
     Drawdown: -0.40%
     → Asset in STRONG HEALTH: positive trends and controlled volatility

🥉 3. Global Equities (ACWI) - SCORE: 76/100
     Price: $146.55
     Trend: BELOW EMA10 | ABOVE EMA50 | ABOVE EMA200
     Performance: 5d -0.53% | 20d +0.16% | 60d +4.35%
     Volatility: 5d 11.3% | 20d 13.3% | 60d 10.9%
     Drawdown: -1.41%
     → Asset in STRONG HEALTH: positive trends and controlled volatility

======================================================================
CORRELATION ANALYSIS - CURRENT vs HISTORICAL
======================================================================

ACWI/BND:
  Current correlation (30d): -0.089
  Historical average (1 year): +0.160
  Deviation: -0.249
  → Weak correlation: moderate diversification

BND/DBC:
  Current correlation (30d): -0.312
  Historical average (1 year): -0.182
  Deviation: -0.131

ACWI/DBC:
  Current correlation (30d): +0.182
  Historical average (1 year): +0.153
  Deviation: +0.029

======================================================================
OPERATIONAL SUMMARY
======================================================================

STRONGEST ASSET: Commodities (Score: 90/100)
WEAKEST ASSET: Global Equities (Score: 76/100)

SUGGESTED ACTION: Favor the strongest asset, maintain risk exposure.
DIVERSIFICATION: EXCELLENT - Asset classes are moving independently.

======================================================================
Analysis automatically generated by kbmeter.com
Date: 2026-03-03
On the macro front, the day features the flash estimate of February 2026 inflation in the Euro area. Also noteworthy are data on China’s labor market and Brazil’s economic performance at the end of 2025. On the macro side, today the focus is on Target’s earnings (U.S. retail).
Already a subscriber? Login here
NOTES AND WARNINGS
Analysis automatically generated by kbmeter.com. Analysis date: 3 March 2026 - 7:31 AM GMT+1
This content is provided for informational purposes only and should not be considered financial advice. All scores and assessments are based on the previous trading day’s closing prices. Futures indications refer to the date and time of the analysis.