Tech Keeps Risk-On Trade Alive Despite Inflation and Rate Concerns
Financial markets remain in a risk-on phase, but the weight of the technology sector in driving this sentiment is becoming increasingly significant. As a result, the impact of the U.S. PPI inflation data and the ongoing crisis in the Middle East is being reflected entirely in bonds and — to some extent — precious metals. Investors are waiting to see what may emerge from the U.S.-China summit regarding tariffs and geopolitical balances. Futures indicate a positive opening for both Europe and the United States.
Market Weather Map
May 14, 2026
US Equities
Eu Equities
Asia Equities
Commodities
Bonds
Dollar Index
Technology
Gold
Oil
Crypto
Market Summary
Financial markets sentiment
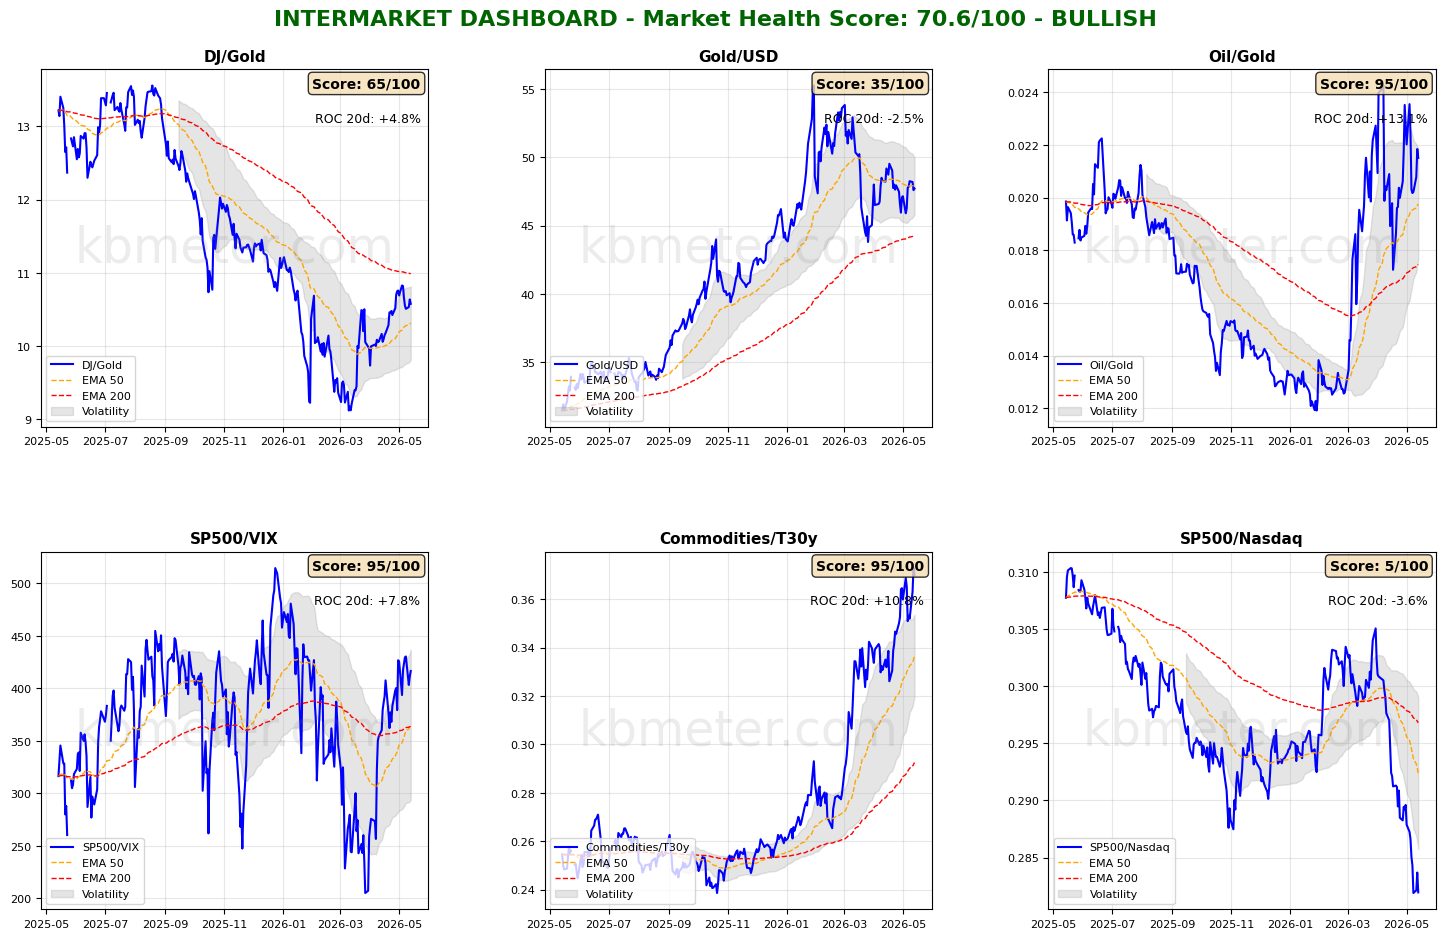
Financial markets are showing a neutral to moderately positive sentiment today. Intermarket analysis highlights a Market Health Score of 71/100 (positive). This morning, we start with the market weather map because the score situation is particularly meaningful: as shown, the only asset class among those monitored that is above 60 points and displaying positive strength is the U.S. technology sector. Indeed, this is the current market environment: equities remain in an upward trend thanks to the momentum coming from the tech sector, which continues to keep the risk-on environment afloat. The S&P 500/Nasdaq ratio remains near the lows of the period, while the S&P 500/VIX ratio stays around early-2026 levels.
However, our intermarket dashboards also reveal the other side of the story — the aspect that markets currently seem unwilling to price in further: gold is losing strength against oil, the dollar, and the Dow; the commodities/30-year Treasury ratio remains at period highs; global bonds are seeing a further rise in yields; and commodities continue to climb. In other words: an inflationary scenario.
Global Futures – Pre-Market Sentiment
Pre-Market Futures: Global futures point to a moderately risk-on sentiment (average +0.25%), with the U.S. slightly positive (+0.14%), Europe slightly positive (+0.48%), and Asia slightly negative (-0.33%).
📊 Global Futures – Pre-Market Sentiment
- TecDAX derived: +1.30%
- CSI 300: +1.03%
- FTSE MIB derived: +0.83%
- Hang Seng derived: -1.42%
- Nikkei 225 derived: -0.59%
- FTSE 100 derived: -0.37%
Intermarket details
📄 Detailed Intermarket Analysis
INTERMARKET ANALYSIS - 2026-05-14
============================================================

MARKET HEALTH SCORE: 70.6/100
SENTIMENT: BULLISH

============================================================
SUMMARY OF KEY RATIOS
============================================================


DJ/Gold:
  - Component score: 65.0/100
  - Current value: 10.5782
  - Position vs EMA50: ABOVE
  - 20-day ROC: +4.77%
  - 50-day ROC: +11.39%
  → Preference for risk assets vs safe havens

Gold/USD:
  - Component score: 35.0/100
  - Current value: 47.7021
  - Position vs EMA50: BELOW
  - 20-day ROC: -2.55%
  - 50-day ROC: -7.49%

Oil/Gold:
  - Component score: 95.0/100
  - Current value: 0.0215
  - Position vs EMA50: ABOVE
  - 20-day ROC: +13.07%
  - 50-day ROC: +47.30%
  → Growing energy demand

SP500/VIX:
  - Component score: 95.0/100
  - Current value: 416.5780
  - Position vs EMA50: ABOVE
  - 20-day ROC: +7.78%
  - 50-day ROC: +44.04%
  → Expanding risk appetite

Commodities/T30y:
  - Component score: 95.0/100
  - Current value: 0.3699
  - Position vs EMA50: ABOVE
  - 20-day ROC: +10.77%
  - 50-day ROC: +26.71%
  → Economic growth expectations

SP500/Nasdaq:
  - Component score: 5.0/100
  - Current value: 0.2820
  - Position vs EMA50: BELOW
  - 20-day ROC: -3.58%
  - 50-day ROC: -6.86%

============================================================
CONCLUSIONS AND RECOMMENDATIONS
============================================================

The market is showing signs of broad-based strength. Intermarket ratios suggest
a favorable environment for risk-taking. Elevated risk appetite and positive trends.
Positioning: CONSTRUCTIVE on risk assets.


STRONGEST RATIOS:
  • Oil/Gold: 95.0/100
  • SP500/VIX: 95.0/100
  • Commodities/T30y: 95.0/100

WEAKEST RATIOS:
  • DJ/Gold: 65.0/100
  • Gold/USD: 35.0/100
  • SP500/Nasdaq: 5.0/100

============================================================
Data processed by kbmeter.com
Date: 2026-05-14
📄 Detailed Asset Allocation Analysis
ASSET ALLOCATION & REGIME ANALYSIS - 2026-05-14
======================================================================
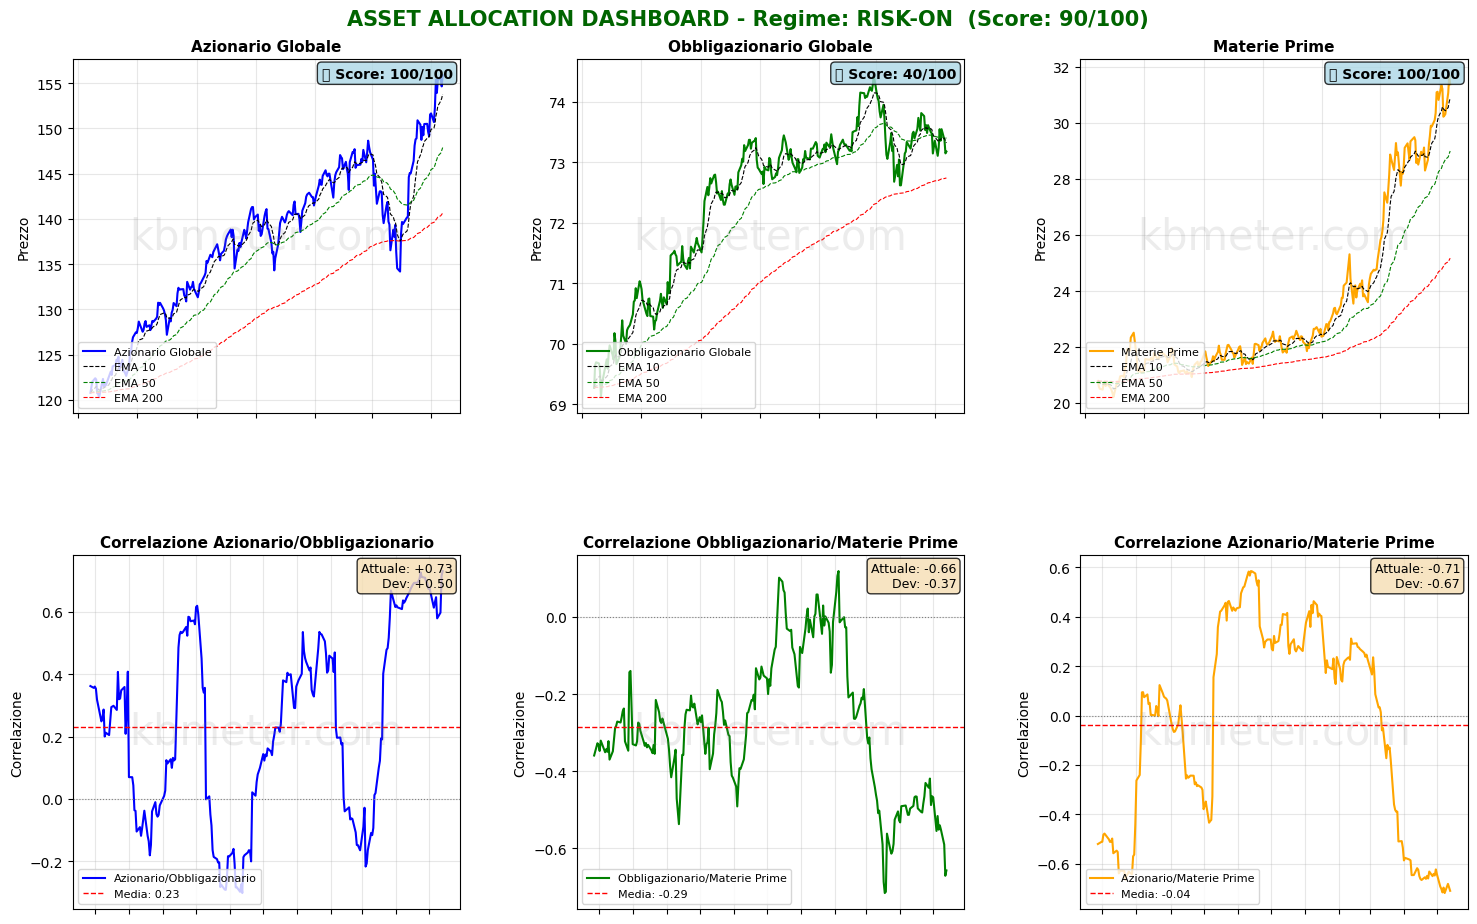
MARKET REGIME: RISK-ON
REGIME SCORE: 90.0/100
======================================================================
TREND AND VOLATILITY ANALYSIS
======================================================================
GLOBAL EQUITIES (ACWI):
Short-Term Trend (5d): +1.27% | ABOVE EMA 10
Medium-Term Trend (20d): +4.69% | ABOVE EMA 50
Long-Term Trend (60d): +6.31% | ABOVE EMA 200
5d Volatility: 13.1%
20d Volatility: 14.3%
60d Volatility: 17.7%
COMMODITIES (DBC):
Medium-Term Trend (20d): +7.76% | ABOVE EMA 50
20d Volatility: 24.6%
ACWI/BND Correlation (30d): 0.732
REGIME INTERPRETATION:
The market is in a risk-on regime. Equities are showing positive trends across multiple
time horizons and volatility remains contained. Investors are favoring risk assets.
Suggested positioning: OVERWEIGHT equities.
======================================================================
ASSET RANKING - WHO IS PERFORMING BEST?
======================================================================
🥇 1. Global Equities (ACWI) - SCORE: 100/100
Price: $155.88
Trend: ABOVE EMA10 | ABOVE EMA50 | ABOVE EMA200
Performance: 5d +1.27% | 20d +4.69% | 60d +6.31%
Volatility: 5d 13.1% | 20d 14.3% | 60d 17.7%
Drawdown: 0.00%
→ Asset in STRONG HEALTH: positive trends and controlled volatility
🥈 2. Commodities (DBC) - SCORE: 100/100
Price: $31.37
Trend: ABOVE EMA10 | ABOVE EMA50 | ABOVE EMA200
Performance: 5d +3.70% | 20d +7.76% | 60d +29.57%
Volatility: 5d 23.2% | 20d 24.6% | 60d 24.6%
Drawdown: -1.01%
→ Asset in STRONG HEALTH: positive trends and controlled volatility
🥉 3. Global Bonds (BND) - SCORE: 40/100
Price: $73.18
Trend: BELOW EMA10 | BELOW EMA50 | ABOVE EMA200
Performance: 5d -0.25% | 20d -0.47% | 60d -1.20%
Volatility: 5d 3.8% | 20d 4.0% | 60d 4.3%
Drawdown: -1.69%
→ Asset in WEAK CONDITIONS: negative trends or elevated volatility
======================================================================
CORRELATION ANALYSIS - CURRENT vs HISTORICAL
======================================================================
ACWI/BND:
Current Correlation (30d): +0.732
Historical Average (1 year): +0.230
Deviation: +0.502
⚠️ SIGNIFICANT DEVIATION from historical average
→ Positive correlation: diversification COMPROMISED
BND/DBC:
Current Correlation (30d): -0.657
Historical Average (1 year): -0.285
Deviation: -0.372
⚠️ SIGNIFICANT DEVIATION from historical average
ACWI/DBC:
Current Correlation (30d): -0.709
Historical Average (1 year): -0.039
Deviation: -0.670
⚠️ SIGNIFICANT DEVIATION from historical average
→ Negative correlation: possible supply-driven shift
======================================================================
OPERATIONAL SUMMARY
======================================================================
STRONGEST ASSET: Global Equities (Score: 100/100)
WEAKEST ASSET: Global Bonds (Score: 40/100)
SUGGESTED ACTION: Favor the strongest asset while maintaining risk exposure.
DIVERSIFICATION: POOR - Asset classes tend to move together.
======================================================================
Data processed by kbmeter.com
Date: 2026-05-14
Macroeconomic Calendar
Today’s macroeconomic calendar features several noteworthy releases. The session begins with UK economic figures for the first quarter of 2026, followed by U.S. retail sales data for April 2026. Investors will also be watching updated U.S. jobless claims data and U.S. import prices for April 2026.
Already a subscriber? Login here
NOTES AND WARNINGS
Data compiled by kbmeter.com. Analysis date: 14 May 2026 - 7:49 AM GMT+1
This content is provided for informational purposes only and should not be considered financial advice. All scores and assessments are based on the previous trading day’s closing prices. Futures indications refer to the date and time of the analysis.