Risk-on fails to return as earnings, Nvidia news and macro data fall short
Positive results from the first 2026 earnings reports, along with favorable news on Nvidia and U.S. macro data, have failed to keep U.S. equity indices afloat, weighed down by uncertainty and some profit-taking. Overall, sentiment remains neutral, with medium-term trends still intact but showing less momentum than a few weeks ago.
Market Weather Map
January 15, 2026
US Equities
Eu Equities
Asia Equities
Commodities
Bonds
Dollar Index
Technology
Gold
Oil
Crypto
Market Summary
📊 Global Futures – Pre-Market Sentiment
- Euro Stoxx 50 derived: +0.30%
- FTSE MIB derived: +0.26%
- Mini DAX: +0.21%
- TecDAX derived: -1.48%
- CSI 300: -0.65%
- Nikkei 225 derived: -0.23%
Pre-Open Futures: Global futures point to a moderately risk-off sentiment (average -0.09%), with the U.S. slightly positive (+0.02%), Europe slightly negative (-0.07%), and Asia slightly negative (-0.31%).
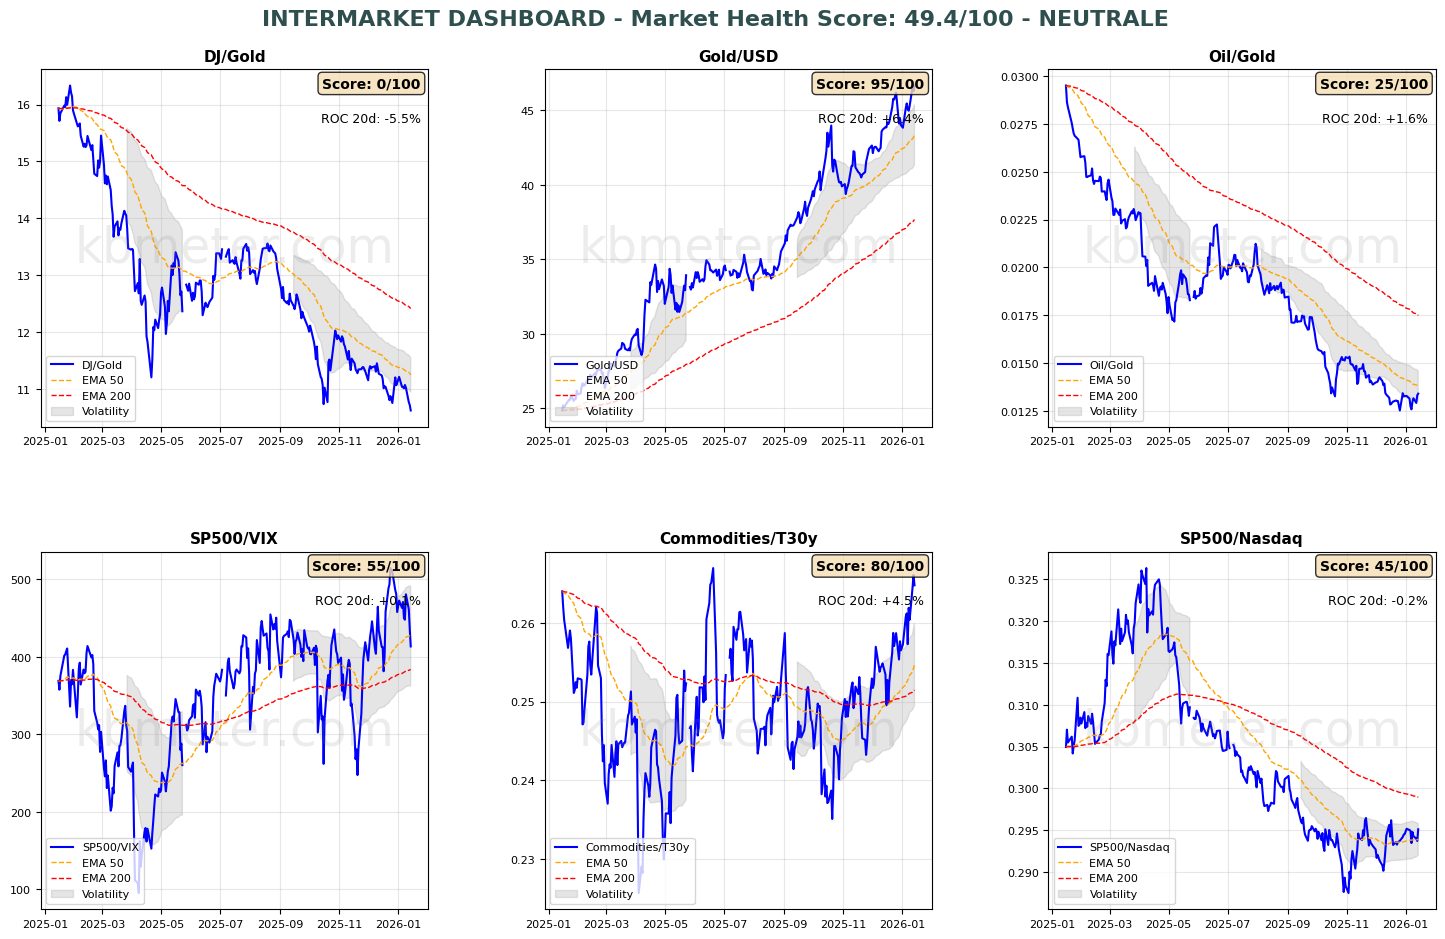
Financial markets are showing a neutral sentiment today. Intermarket analysis points to a Market Health Score of 49/100 (neutral), signaling mixed market conditions. Risk indicators are deteriorating, while gold continues to strengthen against both the Dow and the U.S. dollar. All three asset classes remain biased to the upside, hovering around their short-term averages. For now, there are no clear signs of disruption to the medium-term trend.
Volatility remains at moderate levels, consistent with a normal market environment.
📄 Detailed Intermarket Analysis
INTERMARKET ANALYSIS - 2026-01-15
============================================================

MARKET HEALTH SCORE: 49.4/100
SENTIMENT: NEUTRAL

============================================================
SUMMARY OF KEY RATIOS
============================================================


DJ/Gold:
  - Component score: 0.0/100
  - Current value: 10.6240
  - Position vs EMA50: BELOW
  - 20-day ROC: -5.50%
  - 50-day ROC: -11.05%
  - ⚠️ ANOMALY DETECTED – Significant deviation from the average
  → Flight to safe havens

Gold/USD:
  - Component score: 95.0/100
  - Current value: 46.6690
  - Position vs EMA50: ABOVE
  - 20-day ROC: +6.36%
  - 50-day ROC: +16.96%

Oil/Gold:
  - Component score: 25.0/100
  - Current value: 0.0134
  - Position vs EMA50: BELOW
  - 20-day ROC: +1.61%
  - 50-day ROC: -12.45%
  → Rising energy demand

SP500/VIX:
  - Component score: 55.0/100
  - Current value: 413.5284
  - Position vs EMA50: BELOW
  - 20-day ROC: +0.10%
  - 50-day ROC: +5.43%

Commodities/T30y:
  - Component score: 80.0/100
  - Current value: 0.2648
  - Position vs EMA50: ABOVE
  - 20-day ROC: +4.47%
  - 50-day ROC: +6.83%
  - ⚠️ ANOMALY DETECTED – Significant deviation from the average
  → Economic growth expectations

SP500/Nasdaq:
  - Component score: 45.0/100
  - Current value: 0.2951
  - Position vs EMA50: ABOVE
  - 20-day ROC: -0.18%
  - 50-day ROC: +2.36%

============================================================
CONCLUSIONS AND RECOMMENDATIONS
============================================================

The market is in a neutral/sideways phase. Conflicting signals across ratios.
A clear direction is lacking. Await confirmation.
Positioning: BALANCED, avoid excesses.


STRONGEST RATIOS:
  • Gold/USD: 95.0/100
  • Commodities/T30y: 80.0/100
  • SP500/VIX: 55.0/100

WEAKEST RATIOS:
  • SP500/Nasdaq: 45.0/100
  • Oil/Gold: 25.0/100
  • DJ/Gold: 0.0/100

============================================================
Analysis automatically generated by kbmeter.com
Date: 2026-01-15
📄 Detailed Asset Allocation Analysis
ASSET ALLOCATION & REGIME ANALYSIS - 2026-01-15
======================================================================
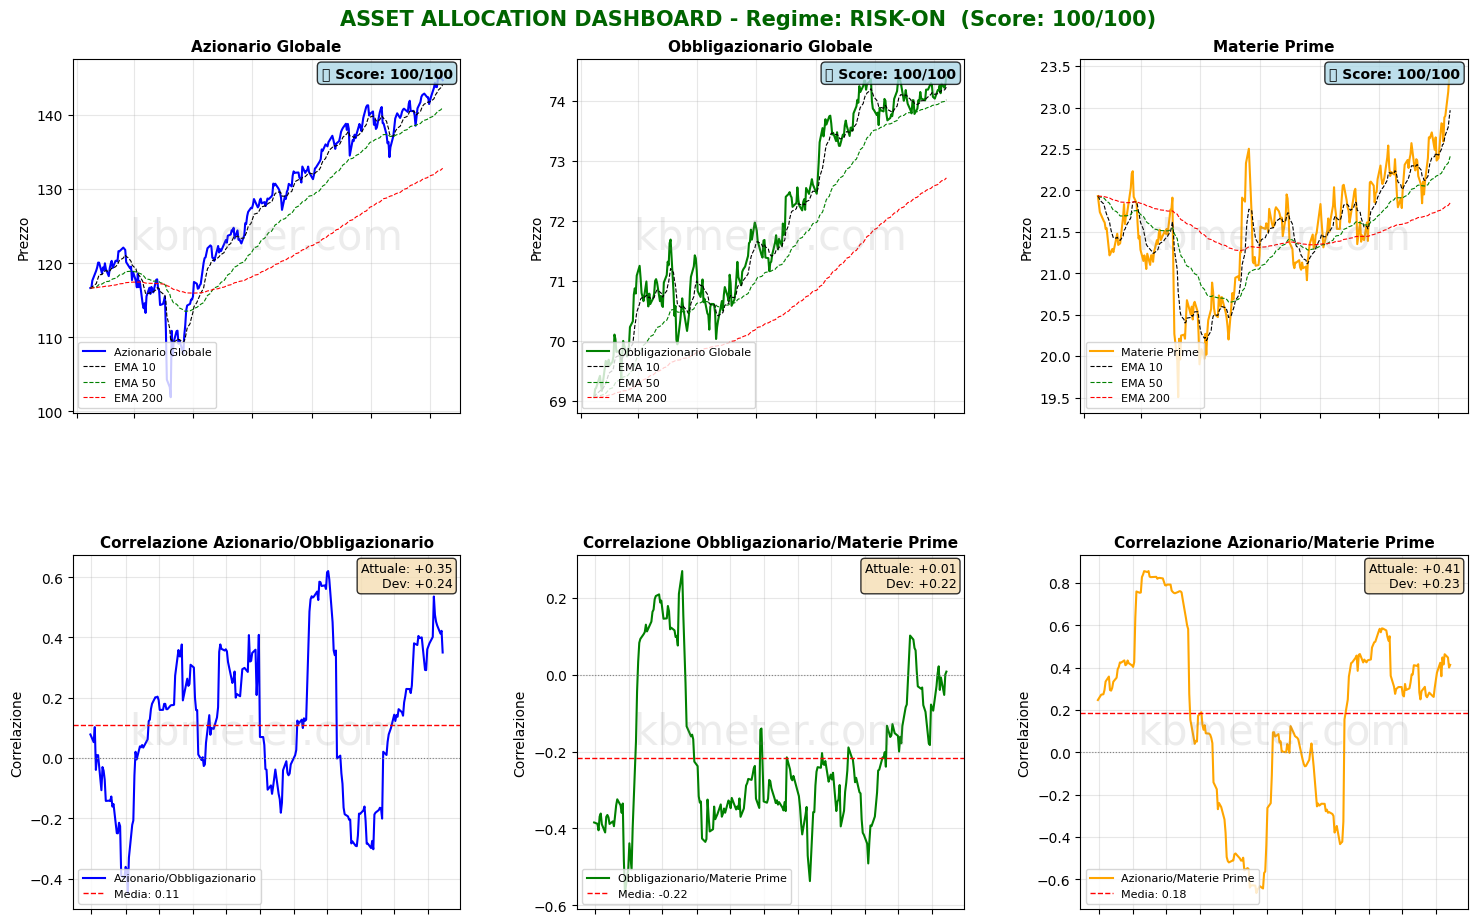
MARKET REGIME: RISK-ON
REGIME SCORE: 100.0/100
======================================================================
TREND AND VOLATILITY ANALYSIS
======================================================================
GLOBAL EQUITIES (ACWI):
Short-Term Trend (5d): +0.65% | ABOVE EMA 10
Medium-Term Trend (20d): +3.37% | ABOVE EMA 50
Long-Term Trend (60d): +4.26% | ABOVE EMA 200
5d Volatility: 6.7%
20d Volatility: 8.7%
60d Volatility: 10.8%
COMMODITIES (DBC):
Medium-Term Trend (20d): +7.07% | ABOVE EMA 50
20d Volatility: 14.5%
ACWI/BND Correlation (30d): 0.350
REGIME INTERPRETATION:
The market is in a risk-on regime. Equities show positive trends across multiple
time horizons and volatility remains contained. Investors are favoring risky assets.
Suggested positioning: OVERWEIGHT equities.
======================================================================
ASSET RANKING – WHO IS PERFORMING BEST?
======================================================================
🥇 1. Global Equities (ACWI) - SCORE: 100/100
Price: $144.71
Trend: ABOVE EMA10 | ABOVE EMA50 | ABOVE EMA200
Performance: 5d +0.65% | 20d +3.37% | 60d +4.26%
Volatility: 5d 6.7% | 20d 8.7% | 60d 10.8%
Drawdown: -0.46%
→ Asset in STRONG HEALTH: positive trends and controlled volatility
🥈 2. Global Bonds (BND) - SCORE: 100/100
Price: $74.43
Trend: ABOVE EMA10 | ABOVE EMA50 | ABOVE EMA200
Performance: 5d +0.40% | 20d +0.56% | 60d +0.25%
Volatility: 5d 2.8% | 20d 2.3% | 60d 2.9%
Drawdown: 0.00%
→ Asset in STRONG HEALTH: positive trends and controlled volatility
🥉 3. Commodities (DBC) - SCORE: 100/100
Price: $23.39
Trend: ABOVE EMA10 | ABOVE EMA50 | ABOVE EMA200
Performance: 5d +2.23% | 20d +7.07% | 60d +8.22%
Volatility: 5d 9.5% | 20d 14.5% | 60d 13.0%
Drawdown: 0.00%
→ Asset in STRONG HEALTH: positive trends and controlled volatility
======================================================================
CORRELATION ANALYSIS – CURRENT vs HISTORICAL
======================================================================
ACWI/BND:
Current correlation (30d): +0.350
Historical average (1 year): +0.111
Deviation: +0.239
→ Positive correlation: diversification IMPAIRED
BND/DBC:
Current correlation (30d): +0.009
Historical average (1 year): -0.216
Deviation: +0.225
ACWI/DBC:
Current correlation (30d): +0.413
Historical average (1 year): +0.184
Deviation: +0.229
======================================================================
OPERATIONAL SUMMARY
======================================================================
STRONGEST ASSET: Global Equities (Score: 100/100)
WEAKEST ASSET: Commodities (Score: 100/100)
SUGGESTED ACTION: Favor the strongest asset, maintain risk exposure.
DIVERSIFICATION: EXCELLENT – Asset classes are moving independently.
======================================================================
Analysis automatically generated by kbmeter.com
Date: 2026-01-15
On the macroeconomic front, the day features U.S. jobless claims, the January Philly Fed and Empire State Index readings, as well as U.S. import and export prices for November 2025. Other notable releases include data on the UK economy in November, Germany’s GDP for 2025, and Eurozone industrial production for November 2025.
On the earnings front, the week continues with results from Goldman Sachs, BlackRock, and Morgan Stanley.
Already a subscriber? Login here
NOTES AND WARNINGS
Data compiled by kbmeter.com. Analysis date: 15 January 2026 - 8:03 AM GMT+1
This content is provided for informational purposes only and should not be considered financial advice. All scores and assessments are based on the previous trading day’s closing prices. Futures indications refer to the date and time of the analysis.