Oil, Fed Eclipse Strong Earnings as Investors Remain Directionless
Financial markets remain stuck in no man’s land even after a Wednesday packed with data releases. The good news on the earnings front (with the exception of Meta) has been overshadowed by the renewed surge in oil prices and the outcome of the Fed meeting (rates left unchanged and a tone that is becoming increasingly less dovish). As a result, sentiment remains in neutral territory, volatility stays elevated, and the risk-on mood is still failing to translate into positive directional momentum.
Today brings another data-heavy session, with Eurozone and U.S. growth figures, rate decisions from the ECB and BoE, and PCE inflation data, alongside earnings reports from Apple and Caterpillar. Futures point to a negative opening for both Europe and the United States.
Market Weather Map
April 30, 2026
US Equities
Eu Equities
Asia Equities
Commodities
Bonds
Dollar Index
Technology
Gold
Oil
Crypto
Market Summary
Financial Markets Sentiment
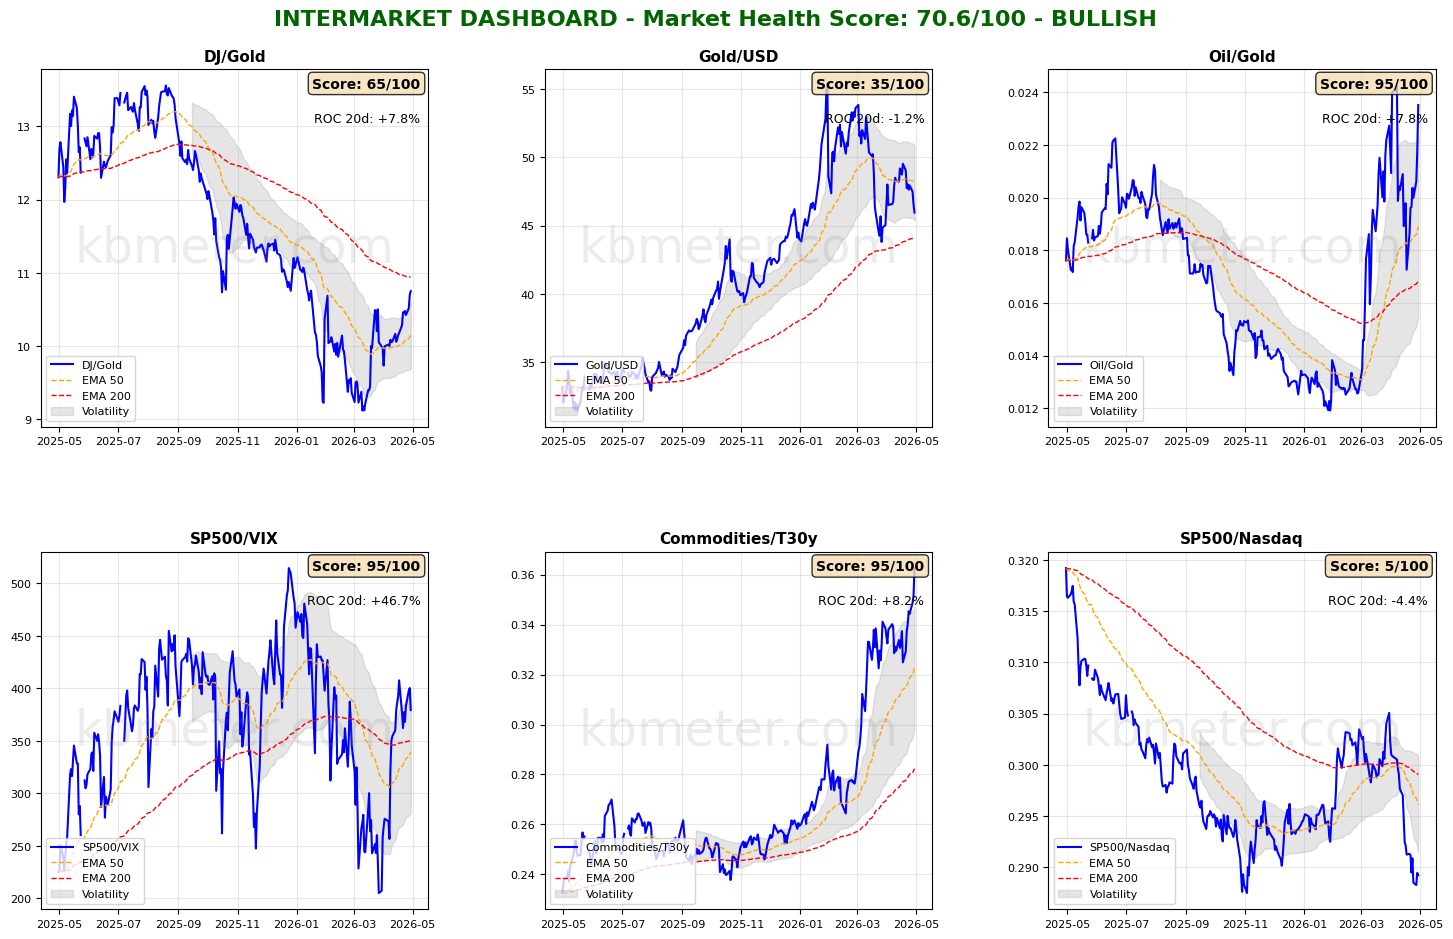
Financial markets are showing a neutral sentiment today. Intermarket analysis highlights a Market Health Score of 71/100 (positive). Our intermarket dashboards suggest that conditions have remained broadly unchanged following yesterday’s much-anticipated session. Risk appetite indicators are still compressed within a moderately positive range, but the real signals are coming from three other intermarket indicators: oil is gaining ground against gold, gold is in turn losing ground against the dollar, all within a context that continues to reflect expectations of persistently high inflation. This is the brake that has prevented markets from gaining direction despite generally positive earnings results.
Across asset classes, inflation expectations—combined with the view of a Fed that is clearly less inclined to cut rates—are weighing on global bonds, pushing them below their 50-day moving average. On the other hand, global equities are failing to regain momentum and remain stuck near the resistance area of the 50-day moving average. Commodities, however, are reaccelerating, led by the strength in oil.
The situation is summarized in our financial markets weather map. Oil has moved back above the 60-point level, offsetting the positive assessment of the technology sector, while the dollar is also recovering. The consequence is weakness in emerging market equities, European equities, and bonds.
Global Futures – Pre-Open Sentiment
Pre-Open Futures: Global futures are signaling a moderate risk-off sentiment (-0.19% on average), with the U.S. slightly negative (-0.33%), Europe slightly negative (-0.42%), and Asia positive (+0.71%).
📊 Global Futures – Pre-Open Sentiment
- CSI 300: +1.31%
- Nikkei 225 derived: +1.14%
- TecDAX derived: +0.65%
- Mini DAX: -1.14%
- Euro Stoxx 50 derived: -1.01%
- DAX derived: -0.93%
Intermarket details
📄 Detailed Intermarket Analysis
INTERMARKET ANALYSIS - 2026-04-30
============================================================

MARKET HEALTH SCORE: 70.6/100
SENTIMENT: BULLISH

============================================================
SUMMARY OF MAIN RATIOS
============================================================


DJ/Gold:
  - Component score: 65.0/100
  - Current value: 10.7502
  - Position vs EMA50: ABOVE
  - 20-day ROC: +7.81%
  - 50-day ROC: +5.97%
  → Preference for risk assets vs safe haven

Gold/USD:
  - Component score: 35.0/100
  - Current value: 45.9482
  - Position vs EMA50: BELOW
  - 20-day ROC: -1.18%
  - 50-day ROC: -8.57%

Oil/Gold:
  - Component score: 95.0/100
  - Current value: 0.0235
  - Position vs EMA50: ABOVE
  - 20-day ROC: +7.80%
  - 50-day ROC: +84.21%
  → Rising energy demand

SP500/VIX:
  - Component score: 95.0/100
  - Current value: 379.3700
  - Position vs EMA50: ABOVE
  - 20-day ROC: +46.73%
  - 50-day ROC: +12.48%
  → Expanding risk appetite

Commodities/T30y:
  - Component score: 95.0/100
  - Current value: 0.3627
  - Position vs EMA50: ABOVE
  - 20-day ROC: +8.17%
  - 50-day ROC: +37.16%
  → Economic growth expectations

SP500/Nasdaq:
  - Component score: 5.0/100
  - Current value: 0.2892
  - Position vs EMA50: BELOW
  - 20-day ROC: -4.35%
  - 50-day ROC: -4.58%

============================================================
CONCLUSIONS AND RECOMMENDATIONS
============================================================

The market is showing broad-based strength signals. Intermarket ratios suggest
a risk-friendly environment. High risk appetite and positive trends.
Positioning: CONSTRUCTIVE on risk assets.


STRONGEST RATIOS:
  • Oil/Gold: 95.0/100
  • SP500/VIX: 95.0/100
  • Commodities/T30y: 95.0/100

WEAKEST RATIOS:
  • DJ/Gold: 65.0/100
  • Gold/USD: 35.0/100
  • SP500/Nasdaq: 5.0/100

============================================================
Analysis automatically generated by kbmeter.com
Date: 2026-04-30
📄 Detailed Asset Allocation Analysis
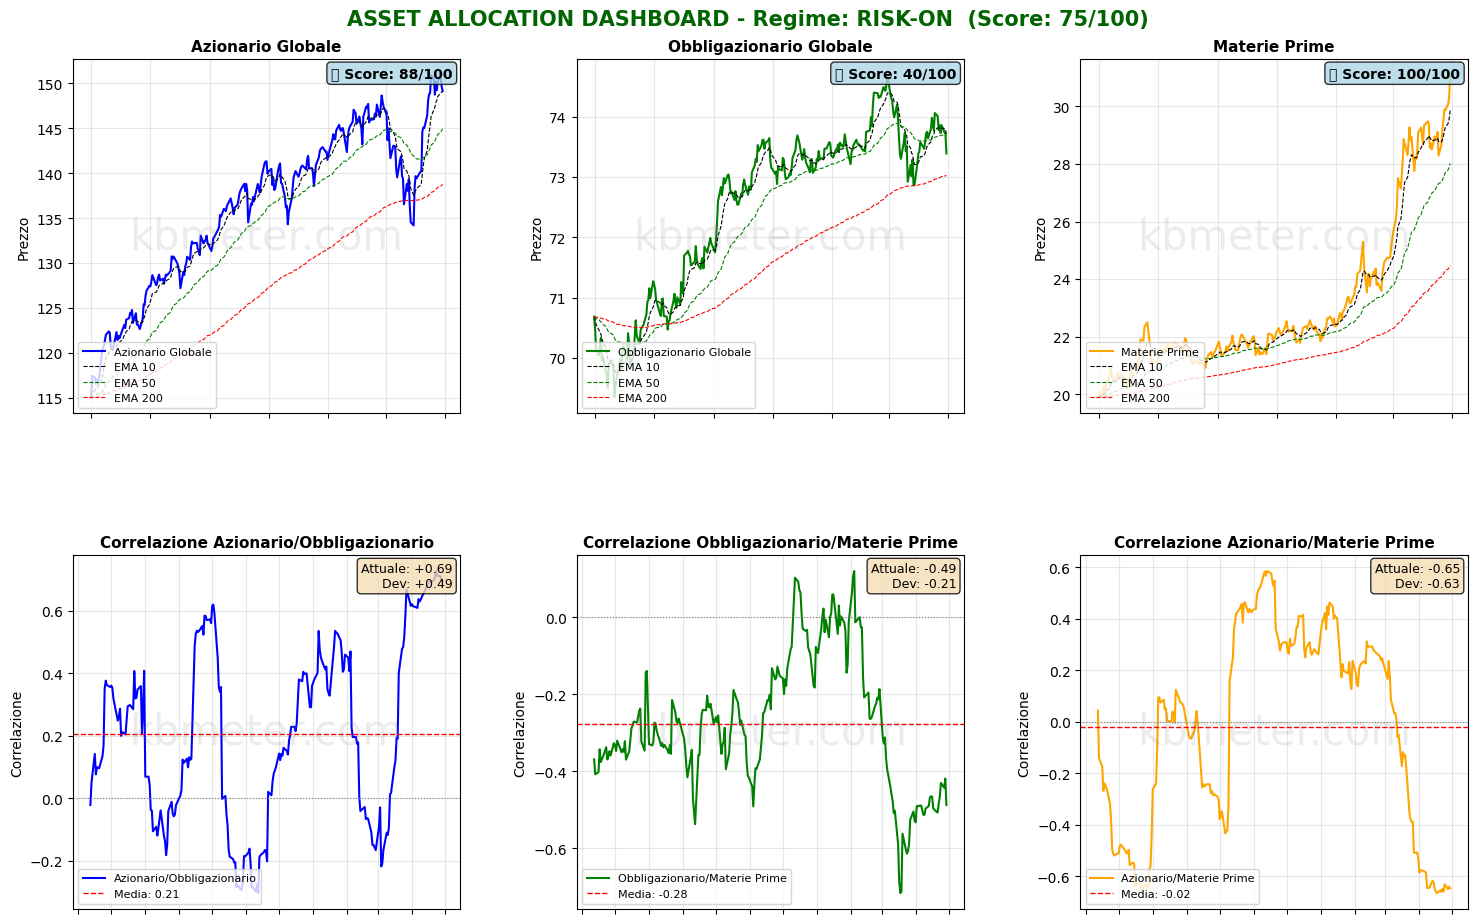
ASSET ALLOCATION & REGIME ANALYSIS - 2026-04-30
======================================================================

MARKET REGIME: RISK-ON
REGIME SCORE: 75.0/100

======================================================================
TREND AND VOLATILITY ANALYSIS
======================================================================

GLOBAL EQUITIES (ACWI):
  Short-Term Trend (5d): -0.07% | ABOVE EMA 10
  Medium-Term Trend (20d): +6.78% | ABOVE EMA 50
  Long-Term Trend (60d): +2.47% | ABOVE EMA 200

  5d Volatility: 9.5%
  20d Volatility: 14.7%
  60d Volatility: 17.6%

COMMODITIES (DBC):
  Medium-Term Trend (20d): +8.37% | ABOVE EMA 50
  20d Volatility: 22.7%

ACWI/BND Correlation (30d): 0.694

REGIME INTERPRETATION:
The market is in a risk-on regime. Equities are showing positive trends across multiple
time horizons and volatility remains contained. Investors favor risk assets.
Suggested positioning: OVERWEIGHT equities.

======================================================================
ASSET RANKING - WHO IS DOING BEST?
======================================================================

🥇 1. Commodities (DBC) - SCORE: 100/100
     Price: $31.08
     Trend: ABOVE EMA10 | ABOVE EMA50 | ABOVE EMA200
     Performance: 5d +3.98% | 20d +8.37% | 60d +28.70%
     Volatility: 5d 14.7% | 20d 22.7% | 60d 24.2%
     Drawdown: 0.00%
     → Asset in STRONG HEALTH: positive trends and controlled volatility

🥈 2. Global Equities (ACWI) - SCORE: 88/100
     Price: $149.14
     Trend: ABOVE EMA10 | ABOVE EMA50 | ABOVE EMA200
     Performance: 5d -0.07% | 20d +6.78% | 60d +2.47%
     Volatility: 5d 9.5% | 20d 14.7% | 60d 17.6%
     Drawdown: -1.17%
     → Asset in STRONG HEALTH: positive trends and controlled volatility

🥉 3. Global Bonds (BND) - SCORE: 40/100
     Price: $73.39
     Trend: BELOW EMA10 | BELOW EMA50 | ABOVE EMA200
     Performance: 5d -0.46% | 20d -0.04% | 60d -0.09%
     Volatility: 5d 3.6% | 20d 3.4% | 60d 4.3%
     Drawdown: -1.74%
     → Asset in WEAK condition: negative trends or elevated volatility

======================================================================
CORRELATION ANALYSIS - CURRENT vs HISTORICAL
======================================================================

ACWI/BND:
  Current Correlation (30d): +0.694
  Historical Average (1 year): +0.207
  Deviation: +0.486
  ⚠️ SIGNIFICANT DEVIATION from historical average
  → Positive correlation: diversification IMPAIRED

BND/DBC:
  Current Correlation (30d): -0.488
  Historical Average (1 year): -0.277
  Deviation: -0.211

ACWI/DBC:
  Current Correlation (30d): -0.647
  Historical Average (1 year): -0.021
  Deviation: -0.627
  ⚠️ SIGNIFICANT DEVIATION from historical average
  → Negative correlation: possible supply-driven shift

======================================================================
OPERATIONAL SUMMARY
======================================================================

STRONGEST ASSET: Commodities (Score: 100/100)
WEAKEST ASSET: Global Bonds (Score: 40/100)

SUGGESTED ACTION: Favor the strongest asset, maintain risk exposure.
DIVERSIFICATION: POOR - Asset classes tend to move together.

======================================================================
Analysis automatically generated by kbmeter.com
Date: 2026-04-30
Macroeconomic Calendar
Another interesting day lies ahead on the macro front. From the Eurozone, April inflation data and the first estimate of Q1 2026 GDP growth will be released. The BoE and ECB will complete the cycle of major central bank meetings with their rate decisions, while the United States will publish Q1 2026 growth data, March consumption figures, and March 2026 PCE inflation.
As for earnings, today it is the turn of—among others—Apple, Mastercard, Eli Lilly, and Caterpillar.
Already a subscriber? Login here
NOTES AND WARNINGS
Data compiled by kbmeter.com. Analysis date: 30 April 2026 - 7:54 AM GMT+1
This content is provided for informational purposes only and should not be considered financial advice. All scores and assessments are based on the previous trading day’s closing prices. Futures indications refer to the date and time of the analysis.