Nvidia Beats Expectations, but Market Sentiment Remains Neutral Despite Gradual Improvement
Nvidia’s numbers beat expectations, but Wall Street’s reaction was rather lukewarm. Sentiment in financial markets remains neutral, although improvements are being recorded in riskier assets (crypto aside). The day offers few macroeconomic catalysts for investors, and attention will once again focus on earnings reports (important on both sides of the Atlantic) and geopolitical developments. Futures indicate a slightly positive opening for Europe and a slightly negative one for the United States.
Market Weather Map
February 26, 2026
US Equities
Eu Equities
Asia Equities
Commodities
Bonds
Dollar Index
Technology
Gold
Oil
Crypto
Market Summary
How to interpret our financial indicators? Find out here.
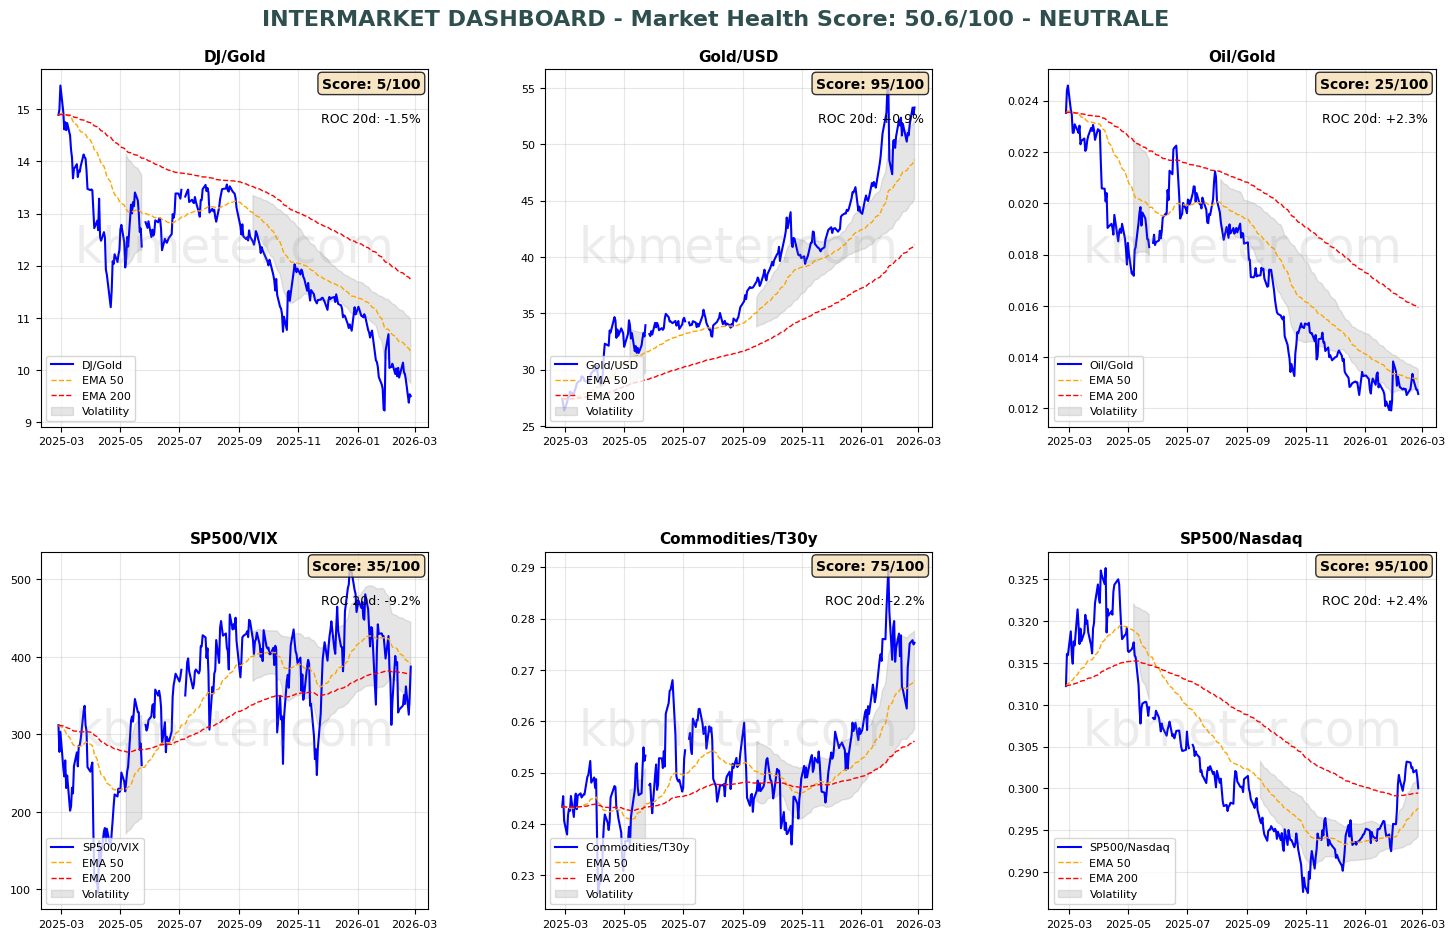
Financial markets today show neutral/slightly positive sentiment. Intermarket analysis highlights a Market Health Score of 51/100 (neutral). Our market weather map shows, on the one hand, the continued presence of uncertainty, and on the other, a trend toward improvement in the main monitored assets. The overall context nevertheless remains highly volatile. Our intermarket dashboards signal an improvement in risk indicators, although markets remain in a volatile phase and very close to the 200-day moving average. There is no significant news, however, regarding the situation of the three main asset classes.
Pre-Opening Futures: Global futures indicate a moderate risk-off sentiment (-0.10% average), with the US slightly negative (-0.19%), Europe slightly positive (+0.15%), and Asia negative (-0.72%).
📊 Global Futures – Pre-Market Sentiment
- IBEX 35 derived: +1.20%
- FTSE MIB derived: +1.09%
- CSI 300: +0.90%
- Nikkei 225 derived: -1.60%
- Hang Seng derived: -1.47%
- CAC 40 derived: -0.46%
📄 Detailed Intermarket Analysis
INTERMARKET ANALYSIS - 2026-02-26
============================================================

MARKET HEALTH SCORE: 50.6/100
SENTIMENT: NEUTRAL

============================================================
MAIN RATIOS SUMMARY
============================================================


DJ/Gold:
  - Component score: 5.0/100
  - Current value: 9.5041
  - Position vs EMA50: BELOW
  - 20-day ROC: -1.48%
  - 50-day ROC: -16.37%
  → Flight to safe haven

Gold/USD:
  - Component score: 95.0/100
  - Current value: 53.2897
  - Position vs EMA50: ABOVE
  - 20-day ROC: +0.94%
  - 50-day ROC: +22.30%

Oil/Gold:
  - Component score: 25.0/100
  - Current value: 0.0126
  - Position vs EMA50: BELOW
  - 20-day ROC: +2.31%
  - 50-day ROC: -6.51%
  → Rising energy demand

SP500/VIX:
  - Component score: 35.0/100
  - Current value: 387.4027
  - Position vs EMA50: BELOW
  - 20-day ROC: -9.24%
  - 50-day ROC: -16.64%
  → Contracting risk appetite

Commodities/T30y:
  - Component score: 75.0/100
  - Current value: 0.2753
  - Position vs EMA50: ABOVE
  - 20-day ROC: -2.21%
  - 50-day ROC: +7.75%
  → Economic growth expectations

SP500/Nasdaq:
  - Component score: 95.0/100
  - Current value: 0.3000
  - Position vs EMA50: ABOVE
  - 20-day ROC: +2.39%
  - 50-day ROC: +2.57%

============================================================
CONCLUSIONS AND RECOMMENDATIONS
============================================================

The market is in a neutral/sideways phase. Mixed signals across the various ratios.
There is no clear direction. Wait for confirmation.
Positioning: BALANCED, avoid excess.


STRONGEST RATIOS:
  • Gold/USD: 95.0/100
  • SP500/Nasdaq: 95.0/100
  • Commodities/T30y: 75.0/100

WEAKEST RATIOS:
  • SP500/VIX: 35.0/100
  • Oil/Gold: 25.0/100
  • DJ/Gold: 5.0/100

============================================================
Analysis automatically generated by kbmeter.com
Date: 2026-02-26
📄 Detailed Asset Allocation Analysis
ASSET ALLOCATION & REGIME ANALYSIS - 2026-02-26
======================================================================
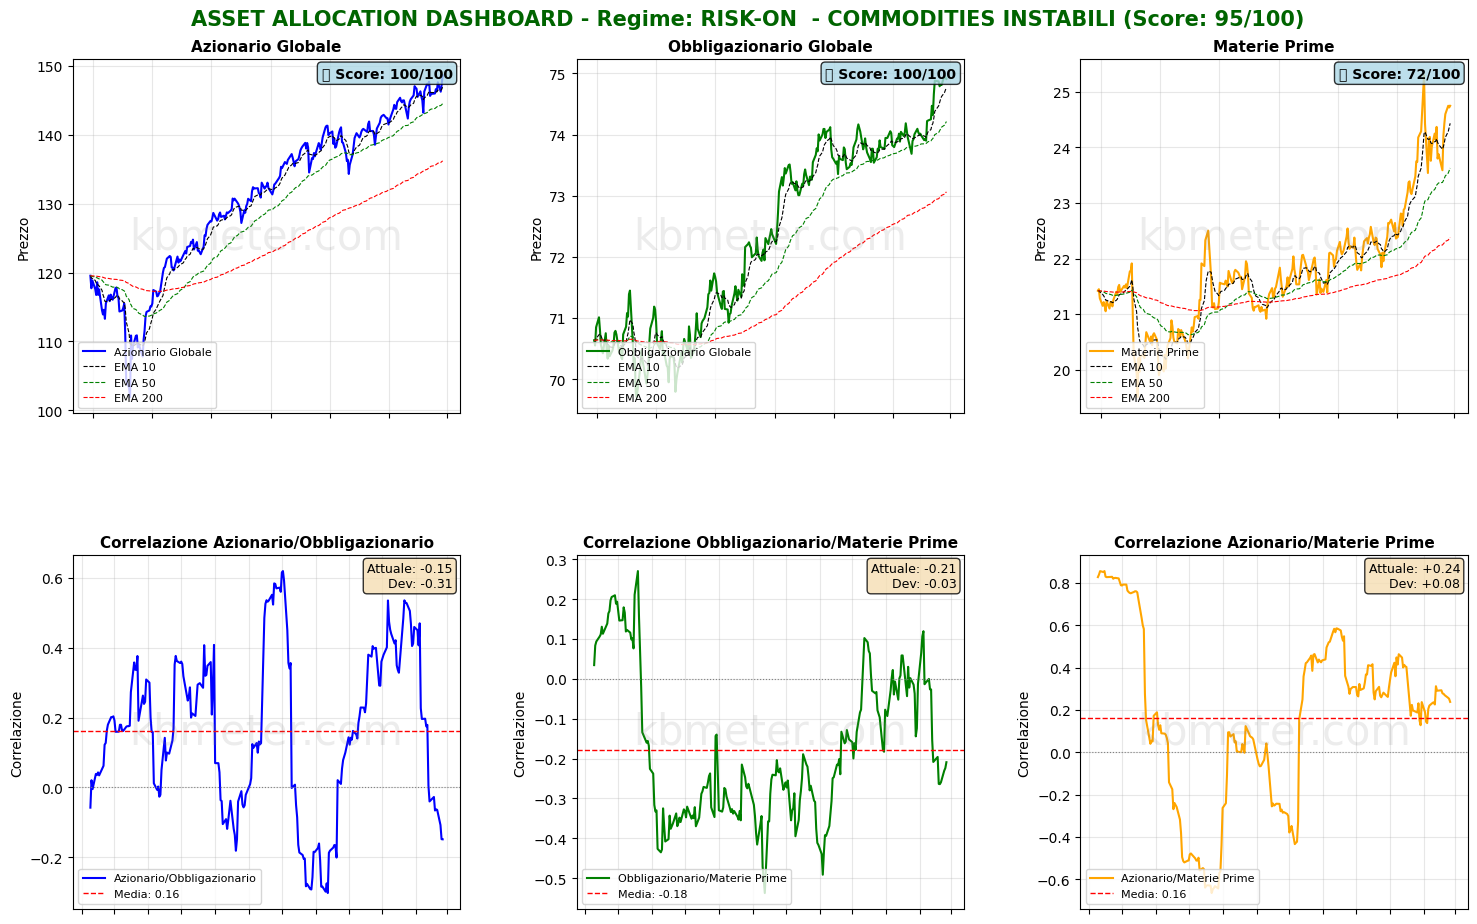
MARKET REGIME: RISK-ON - UNSTABLE COMMODITIES
REGIME SCORE: 95.0/100
======================================================================
TREND AND VOLATILITY ANALYSIS
======================================================================
GLOBAL EQUITIES (ACWI):
Short-Term Trend (5d): +1.58% | ABOVE EMA 10
Medium-Term Trend (20d): +1.23% | ABOVE EMA 50
Long-Term Trend (60d): +6.00% | ABOVE EMA 200
5d Volatility: 12.9%
20d Volatility: 13.3%
60d Volatility: 10.8%
COMMODITIES (DBC):
Medium-Term Trend (20d): -0.76% | ABOVE EMA 50
20d Volatility: 27.6%
ACWI/BND Correlation (30d): -0.149
REGIME INTERPRETATION:
The market is in a risk-on regime. Equities show positive trends across multiple
time horizons and volatility remains contained. Investors favor risk assets.
Suggested positioning: OVERWEIGHT equities.
⚠️ COMMODITIES ALERT: Commodities are showing elevated volatility. This may
indicate uncertainty about economic growth or unstable supply/demand dynamics.
======================================================================
ASSET RANKING - WHO IS PERFORMING BEST?
======================================================================
🥇 1. Global Equities (ACWI) - SCORE: 100/100
Price: $148.65
Trend: ABOVE EMA10 | ABOVE EMA50 | ABOVE EMA200
Performance: 5d +1.58% | 20d +1.23% | 60d +6.00%
Volatility: 5d 12.9% | 20d 13.3% | 60d 10.8%
Drawdown: 0.00%
→ Asset in STRONG HEALTH: positive trends and controlled volatility
🥈 2. Global Bonds (BND) - SCORE: 100/100
Price: $74.91
Trend: ABOVE EMA10 | ABOVE EMA50 | ABOVE EMA200
Performance: 5d +0.12% | 20d +1.22% | 60d +1.16%
Volatility: 5d 1.7% | 20d 2.9% | 60d 2.8%
Drawdown: -0.08%
→ Asset in STRONG HEALTH: positive trends and controlled volatility
🥉 3. Commodities (DBC) - SCORE: 72/100
Price: $24.75
Trend: ABOVE EMA10 | ABOVE EMA50 | ABOVE EMA200
Performance: 5d +1.31% | 20d -0.76% | 60d +10.94%
Volatility: 5d 6.8% | 20d 27.6% | 60d 19.4%
Drawdown: -2.17%
→ Asset in STRONG HEALTH: positive trends and controlled volatility
======================================================================
CORRELATION ANALYSIS - CURRENT vs HISTORICAL
======================================================================
ACWI/BND:
Current correlation (30d): -0.149
Historical average (1 year): +0.162
Deviation: -0.310
⚠️ SIGNIFICANT DEVIATION from historical average
→ Weak correlation: moderate diversification
BND/DBC:
Current correlation (30d): -0.209
Historical average (1 year): -0.177
Deviation: -0.032
ACWI/DBC:
Current correlation (30d): +0.238
Historical average (1 year): +0.161
Deviation: +0.077
======================================================================
OPERATIONAL SUMMARY
======================================================================
STRONGEST ASSET: Global Equities (Score: 100/100)
WEAKEST ASSET: Commodities (Score: 72/100)
SUGGESTED ACTION: Favor the strongest asset, maintain risk exposure.
DIVERSIFICATION: EXCELLENT - Asset classes are moving independently.
======================================================================
Analysis automatically generated by kbmeter.com
Date: 2026-02-26
On the macro front, the day offers few highlights. Worth noting are the update of Economic Sentiment for the Euro area, trends in loans to households and businesses in the Eurozone last January, and weekly US jobless claims data.
On the earnings front, after Nvidia’s positive results, attention today shifts to Dell and CoreWeave.
Already a subscriber? Login here
NOTES AND WARNINGS
Analysis automatically generated by kbmeter.com. Analysis date: 26 February 2026 - 7:37 AM GMT+1
This content is provided for informational purposes only and should not be considered financial advice. All scores and assessments are based on the previous trading day’s closing prices. Futures indications refer to the date and time of the analysis.