Middle East Tensions Weigh on Market Sentiment; Dollar Strengthens as Treasuries Price In a Fed on Hold
The situation in the Middle East continues to dominate investors’ thinking, amid technical rebounds, some attempts at buy-the-dip strategies, and reflections on the potential consequences for inflation and the economy in the coming months. Sentiment in financial markets remains tilted toward risk-off, though without further significant downside shocks.
While awaiting the official U.S. labor market data (due tomorrow), the dollar continues to strengthen, and U.S. government bonds are pricing in a Fed on hold for a prolonged time. Futures point to an opening in positive territory for Europe, while the United States is set to start in the red.
Market Weather Map
March 5, 2026
US Equities
Eu Equities
Asia Equities
Commodities
Bonds
Dollar Index
Technology
Gold
Oil
Crypto
Market Summary
How to interpret our financial indicators? Find out here.
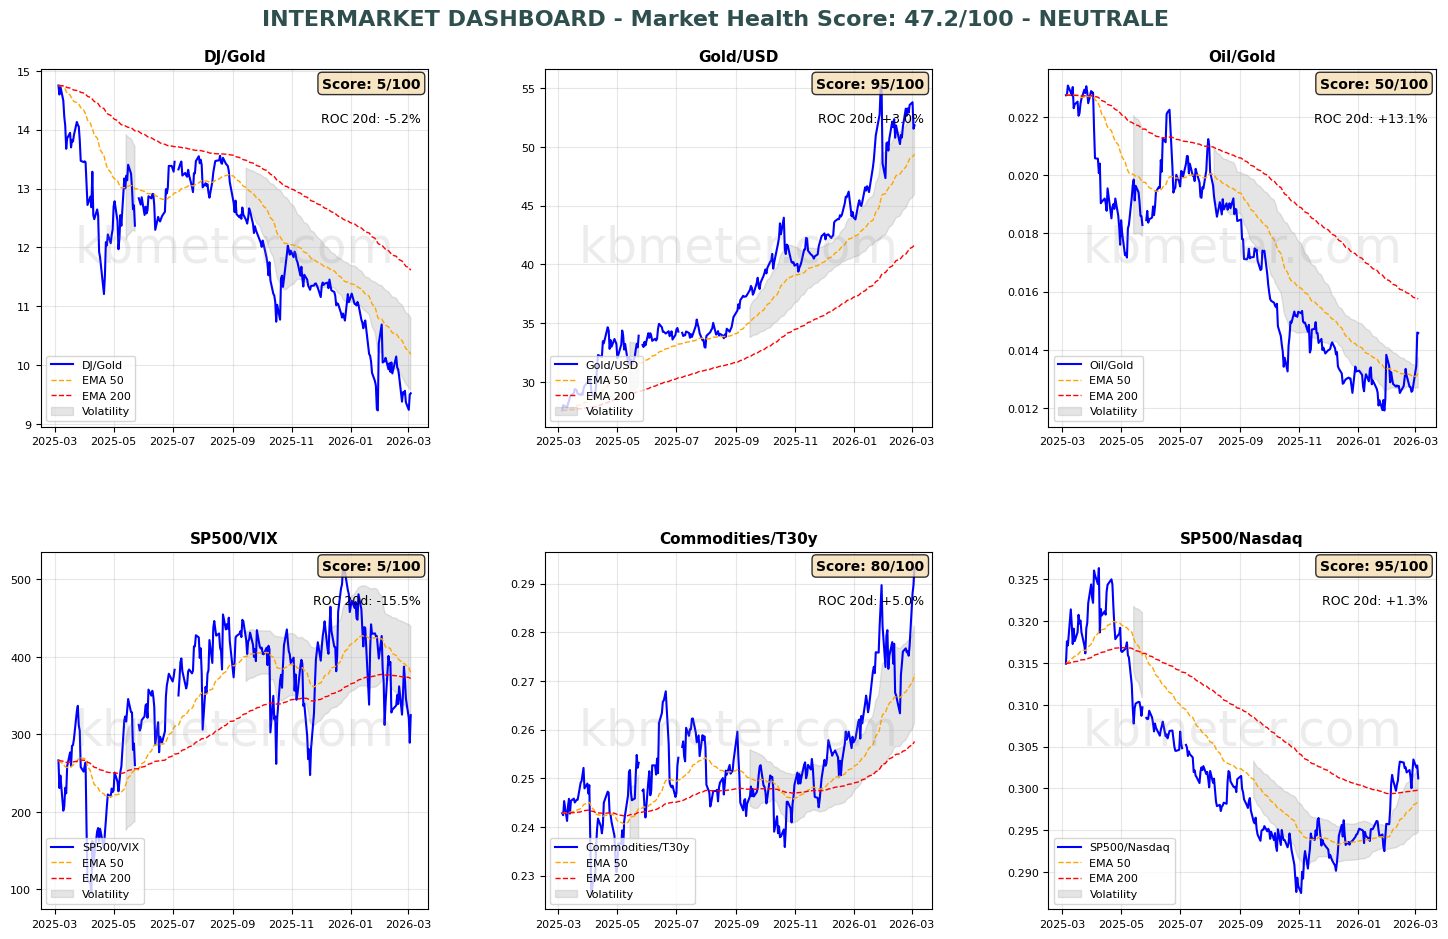
Financial markets today show a neutral to moderately negative sentiment. Intermarket analysis highlights a Market Health Score of 47/100 (neutral). Our intermarket dashboards reflect the effects of a session that can be described more as consolidation than a genuine recovery. Risk indicators remain weak and highly volatile, while the Oil/Gold ratio holds steady at last November’s levels.
Notably, the dollar has regained strength (with today’s Dollar Index Health Score at 69.5 and an ongoing bullish trend), pushing its ratio with gold back to late-January levels.
Across asset classes, there are few new developments: global equities are holding the support of the 50-day moving average; bonds are losing momentum amid renewed inflation concerns and have fallen below the fast moving average; commodities continue their short-term acceleration, driven by energy and precious metals.
Pre-Opening Futures: Global futures indicate a moderate risk-off sentiment (average -0.16%), with the U.S. slightly negative (-0.43%), Europe slightly positive (+0.36%), and Asia sharply negative (-1.38%).
📊 Global Futures – Pre-Opening Sentiment
- TecDAX derived: +2.45%
- IBEX 35 derived: +2.31%
- FTSE MIB derived: +1.96%
- Nikkei 225 derived: -1.93%
- CSI 300: -1.27%
- Hang Seng derived: -0.93%
📄 Detailed Intermarket Analysis
INTERMARKET ANALYSIS - 2026-03-05
============================================================

MARKET HEALTH SCORE: 47.2/100
SENTIMENT: NEUTRAL

============================================================
SUMMARY OF MAIN RATIOS
============================================================


DJ/Gold:
  - Component score: 5.0/100
  - Current value: 9.5190
  - Position vs EMA50: BELOW
  - 20-day ROC: -5.20%
  - 50-day ROC: -13.86%
  → Flight to safe haven

Gold/USD:
  - Component score: 95.0/100
  - Current value: 51.8396
  - Position vs EMA50: ABOVE
  - 20-day ROC: +3.01%
  - 50-day ROC: +17.58%

Oil/Gold:
  - Component score: 50.0/100
  - Current value: 0.0146
  - Position vs EMA50: ABOVE
  - 20-day ROC: +13.12%
  - 50-day ROC: +12.69%
  - ⚠️ ANOMALY DETECTED - Significant deviation from the mean
  → Rising energy demand

SP500/VIX:
  - Component score: 5.0/100
  - Current value: 324.7991
  - Position vs EMA50: BELOW
  - 20-day ROC: -15.49%
  - 50-day ROC: -19.12%
  → Contracting risk appetite

Commodities/T30y:
  - Component score: 80.0/100
  - Current value: 0.2932
  - Position vs EMA50: ABOVE
  - 20-day ROC: +4.99%
  - 50-day ROC: +16.99%
  - ⚠️ ANOMALY DETECTED - Significant deviation from the mean
  → Economic growth expectations

SP500/Nasdaq:
  - Component score: 95.0/100
  - Current value: 0.3012
  - Position vs EMA50: ABOVE
  - 20-day ROC: +1.25%
  - 50-day ROC: +2.28%

============================================================
CONCLUSIONS AND RECOMMENDATIONS
============================================================

The market is in a neutral/sideways phase. Conflicting signals across the various ratios.
There is no clear directional bias. Wait for confirmation.
Positioning: BALANCED, avoid excess exposure.


STRONGEST RATIOS:
  • Gold/USD: 95.0/100
  • SP500/Nasdaq: 95.0/100
  • Commodities/T30y: 80.0/100

WEAKEST RATIOS:
  • Oil/Gold: 50.0/100
  • DJ/Gold: 5.0/100
  • SP500/VIX: 5.0/100

============================================================
Analysis automatically generated by kbmeter.com
Date: 2026-03-05
📄 Detailed Asset Allocation Analysis
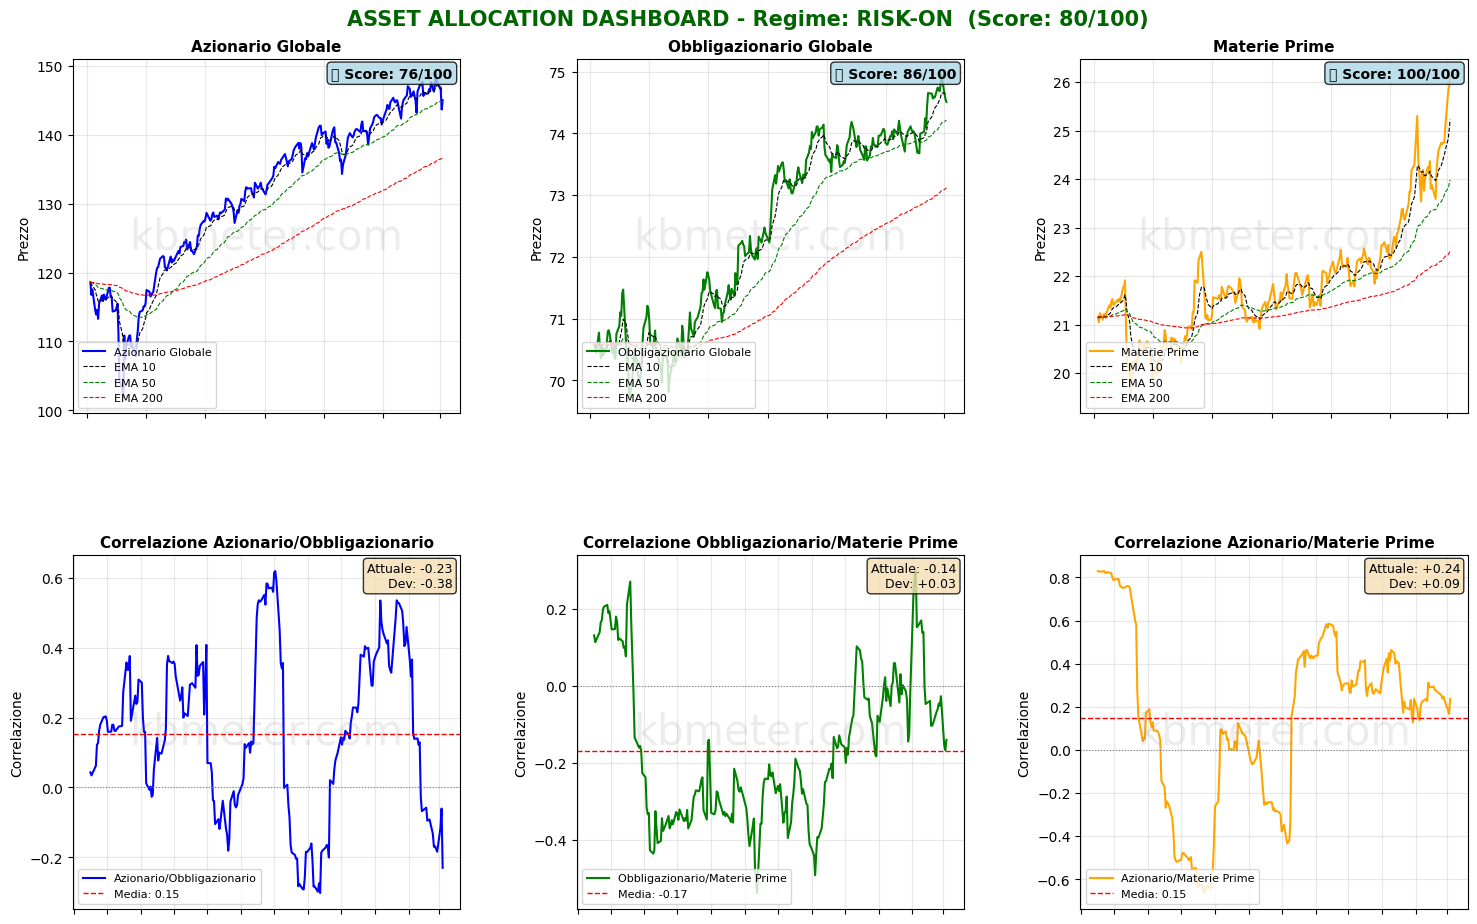
ASSET ALLOCATION & REGIME ANALYSIS - 2026-03-05
======================================================================

MARKET REGIME: RISK-ON
REGIME SCORE: 80.0/100

======================================================================
TREND AND VOLATILITY ANALYSIS
======================================================================

GLOBAL EQUITIES (ACWI):
  Short Trend (5d): -1.99% | BELOW EMA 10
  Medium Trend (20d): +0.01% | ABOVE EMA 50
  Long Trend (60d): +2.94% | ABOVE EMA 200

  Volatility 5d: 16.2%
  Volatility 20d: 15.2%
  Volatility 60d: 11.8%

COMMODITIES (DBC):
  Medium Trend (20d): +8.06% | ABOVE EMA 50
  Volatility 20d: 19.8%

ACWI/BND Correlation (30d): -0.230

REGIME INTERPRETATION:
The market is in a risk-on regime. Equities show positive trends across multiple
time horizons and volatility remains contained. Investors favor risk assets.
Suggested positioning: OVERWEIGHT equities.

======================================================================
ASSET RANKING - WHO IS PERFORMING BEST?
======================================================================

🥇 1. Commodities (DBC) - SCORE: 100/100
     Price: $26.14
     Trend: ABOVE EMA10 | ABOVE EMA50 | ABOVE EMA200
     Performance: 5d +5.57% | 20d +8.06% | 60d +15.82%
     Volatility: 5d 17.3% | 20d 19.8% | 60d 20.1%
     Drawdown: 0.00%
     → Asset in STRONG HEALTH: positive trends and controlled volatility

🥈 2. Global Bonds (BND) - SCORE: 86/100
     Price: $74.51
     Trend: BELOW EMA10 | ABOVE EMA50 | ABOVE EMA200
     Performance: 5d -0.38% | 20d +1.13% | 60d +1.06%
     Volatility: 5d 3.8% | 20d 3.4% | 60d 3.0%
     Drawdown: -0.58%
     → Asset in STRONG HEALTH: positive trends and controlled volatility

🥉 3. Global Equities (ACWI) - SCORE: 76/100
     Price: $145.00
     Trend: BELOW EMA10 | ABOVE EMA50 | ABOVE EMA200
     Performance: 5d -1.99% | 20d +0.01% | 60d +2.94%
     Volatility: 5d 16.2% | 20d 15.2% | 60d 11.8%
     Drawdown: -2.46%
     → Asset in STRONG HEALTH: positive trends and controlled volatility

======================================================================
CORRELATION ANALYSIS - CURRENT vs HISTORICAL
======================================================================

ACWI/BND:
  Current correlation (30d): -0.230
  Historical average (1 year): +0.154
  Deviation: -0.384
  ⚠️ SIGNIFICANT DEVIATION from historical average
  → Weak correlation: moderate diversification

BND/DBC:
  Current correlation (30d): -0.140
  Historical average (1 year): -0.169
  Deviation: +0.029

ACWI/DBC:
  Current correlation (30d): +0.236
  Historical average (1 year): +0.147
  Deviation: +0.089

======================================================================
OPERATIONAL SUMMARY
======================================================================

STRONGEST ASSET: Commodities (Score: 100/100)
WEAKEST ASSET: Global Equities (Score: 76/100)

SUGGESTED ACTION: Favor the strongest asset, maintain risk exposure.
DIVERSIFICATION: EXCELLENT - Asset classes are moving independently.

======================================================================
Analysis automatically generated by kbmeter.com
Date: 2026-03-05
On the macro front, today’s agenda includes January retail sales data for the Euro area, the weekly update on U.S. jobless claims, the first official U.S. labor market data (productivity and labor costs for the last quarter of 2025), and January U.S. import and export price data.
On the earnings front, results from Costco and Marvell Technology are due today.
Already a subscriber? Login here
NOTES AND WARNINGS
Analysis automatically generated by kbmeter.com. Analysis date: 5 March 2026 - 7:37 AM GMT+1
This content is provided for informational purposes only and should not be considered financial advice. All scores and assessments are based on the previous trading day’s closing prices. Futures indications refer to the date and time of the analysis.