Markets Whipsawed in Headline-Driven Monday; Investors Eye March PMI Data
A rollercoaster Monday for financial markets, in a session that some analysts described as “headline-driven,” meaning influenced primarily by news agency releases. Whether negotiations will take place or not, the war in Iran remains at the center of attention, with sentiment still hovering between neutral and negative and only limited improvement in risk appetite indicators.
During the day, March PMI surveys will provide the first insights into the impact of the conflict on manufacturing and services (with the latter currently appearing more affected). Futures point to a weak opening for both Europe and the United States.
Market Weather Map
March 24, 2026
US Equities
Eu Equities
Asia Equities
Commodities
Bonds
Dollar Index
Technology
Gold
Oil
Crypto
Market Summary
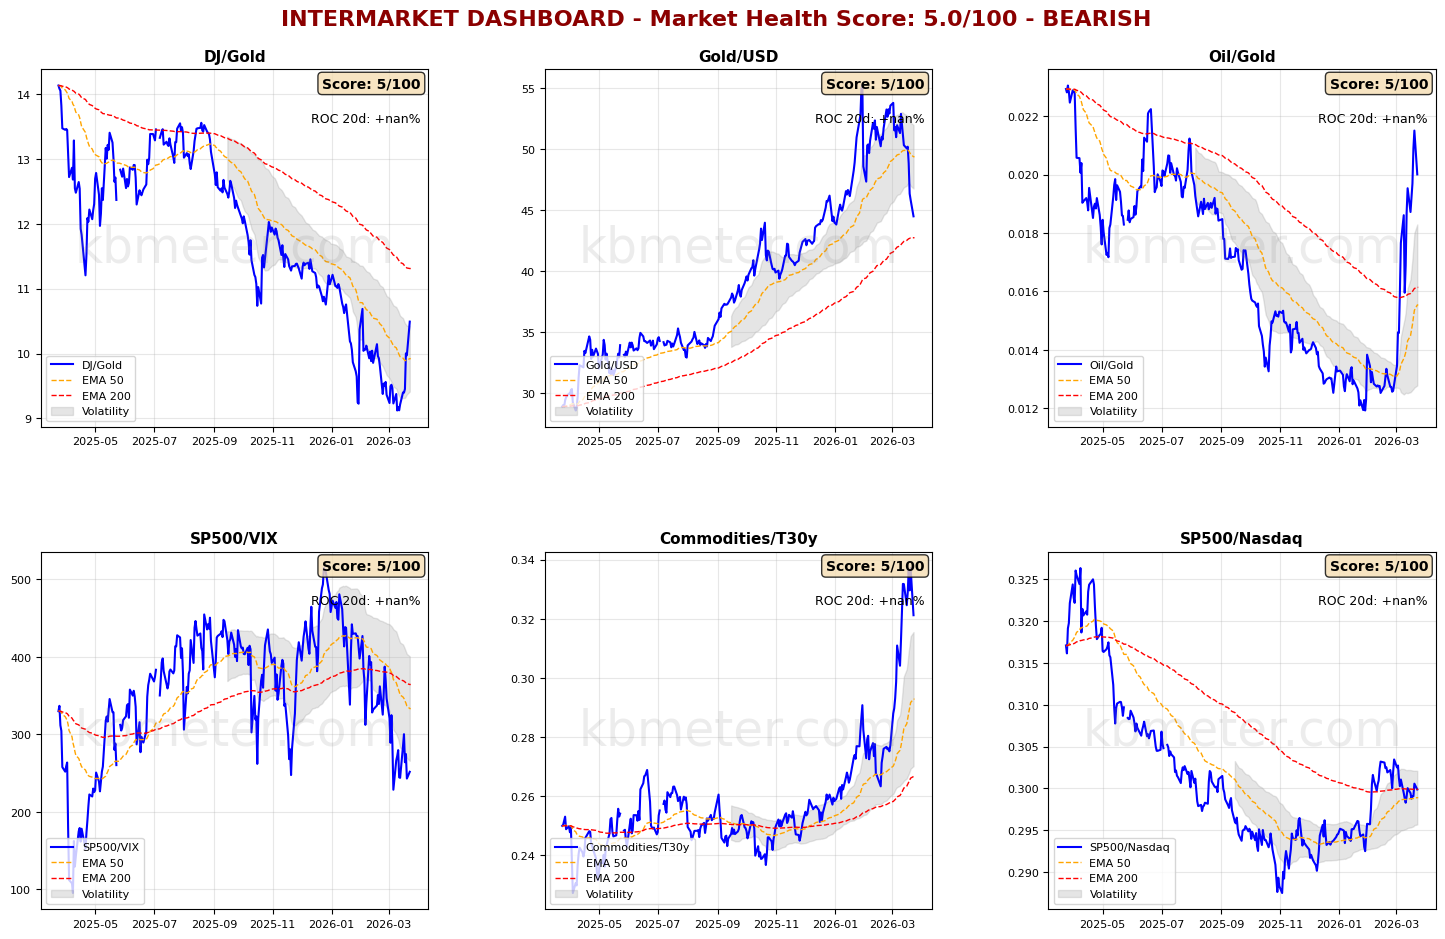
Financial markets today show a neutral to moderately negative sentiment. Intermarket analysis highlights a Market Health Score of 5/100 (negative). Our intermarket dashboards indicate that yesterday’s volatile, headline-driven session mainly impacted oil prices, while effects on risk appetite indicators and gold appear much more limited.
It is worth noting that the Dow/Gold ratio has broken above its medium-term moving average, while the Gold/Dollar ratio is approaching its long-term moving average—signals that financial markets are moving closer to very delicate zones that could influence their future direction.
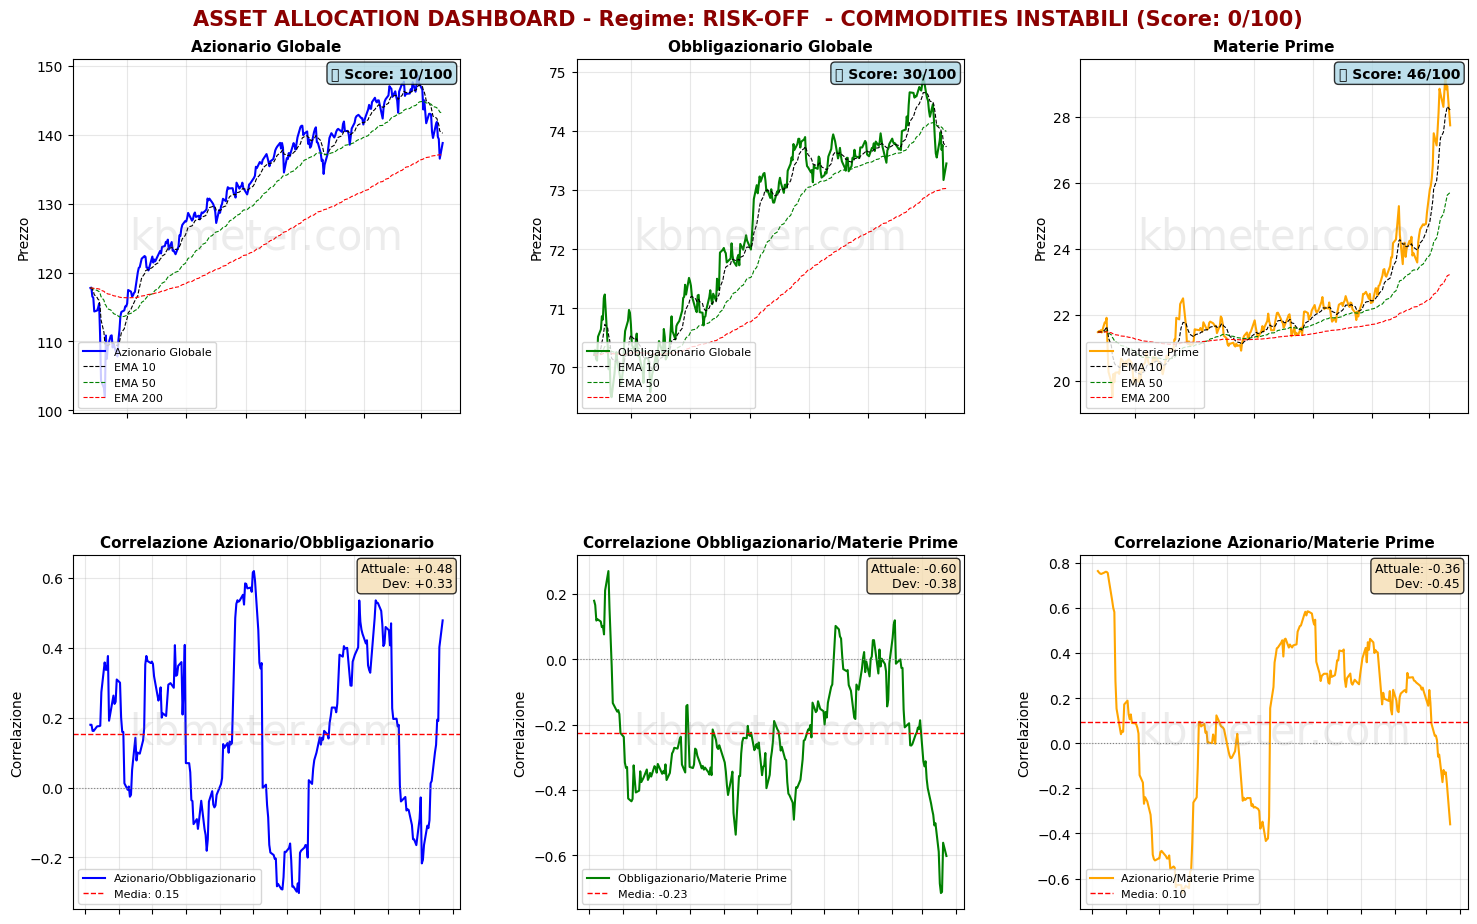
On the asset front, there is little new to report. The long-term moving average is holding back the downward movement in both global equities and bonds, while the decline in crude oil has pushed commodities back below their short-term moving average. Equities and bonds continue to show a moderately positive correlation.
Pre-market futures: Global futures indicate a risk-off sentiment (average -0.57%), with the U.S. negative (-0.52%), Europe slightly negative (-0.06%), and Asia sharply negative (-2.18%).
📊 Global Futures – Pre-Opening Sentiment
- IBEX 35 derived: +3.12%
- FTSE MIB derived: +1.03%
- Mini MDAX derived: +0.00%
- CSI 300: -3.74%
- Nikkei 225 derived: -2.01%
- CAC 40 derived: -1.22%
📄 Detailed Intermarket Analysis
INTERMARKET ANALYSIS - 2026-03-24
============================================================

MARKET HEALTH SCORE: 5.0/100
SENTIMENT: BEARISH

============================================================
SUMMARY OF KEY RATIOS
============================================================


DJ/Gold:
  - Component score: 5.0/100
  - Current value: nan
  - Position vs EMA50: BELOW
  - 20-day ROC: +nan%
  - 50-day ROC: +nan%
  → Flight to safe haven

Gold/USD:
  - Component score: 5.0/100
  - Current value: nan
  - Position vs EMA50: BELOW
  - 20-day ROC: +nan%
  - 50-day ROC: +nan%

Oil/Gold:
  - Component score: 5.0/100
  - Current value: nan
  - Position vs EMA50: BELOW
  - 20-day ROC: +nan%
  - 50-day ROC: +nan%
  → Declining energy demand

SP500/VIX:
  - Component score: 5.0/100
  - Current value: nan
  - Position vs EMA50: BELOW
  - 20-day ROC: +nan%
  - 50-day ROC: +nan%

Commodities/T30y:
  - Component score: 5.0/100
  - Current value: nan
  - Position vs EMA50: BELOW
  - 20-day ROC: +nan%
  - 50-day ROC: +nan%
  → Slowdown expectations

SP500/Nasdaq:
  - Component score: 5.0/100
  - Current value: nan
  - Position vs EMA50: BELOW
  - 20-day ROC: +nan%
  - 50-day ROC: +nan%

============================================================
CONCLUSIONS AND RECOMMENDATIONS
============================================================

The market is in bearish territory. Widespread stress signals.
Flight from risk is underway. Maximum caution advised.
Positioning: VERY DEFENSIVE, capital preservation.


STRONGEST RATIOS:
  • DJ/Gold: 5.0/100
  • Gold/USD: 5.0/100
  • Oil/Gold: 5.0/100

WEAKEST RATIOS:
  • SP500/VIX: 5.0/100
  • Commodities/T30y: 5.0/100
  • SP500/Nasdaq: 5.0/100

============================================================
Analysis automatically generated by kbmeter.com
Date: 2026-03-24
📄 Detailed Asset Allocation Analysis
ASSET ALLOCATION & REGIME ANALYSIS - 2026-03-24
======================================================================

MARKET REGIME: RISK-OFF - UNSTABLE COMMODITIES
REGIME SCORE: 0.0/100

======================================================================
TREND AND VOLATILITY ANALYSIS
======================================================================

GLOBAL EQUITIES (ACWI):
  Short-Term Trend (5d): -2.16% | BELOW EMA 10
  Medium-Term Trend (20d): -5.78% | BELOW EMA 50
  Long-Term Trend (60d): -2.73% | ABOVE EMA 200

  Volatility 5d: 23.4%
  Volatility 20d: 17.8%
  Volatility 60d: 14.0%

COMMODITIES (DBC):
  Medium-Term Trend (20d): +12.26% | ABOVE EMA 50
  Volatility 20d: 28.7%

ACWI/BND Correlation (30d): 0.479

REGIME INTERPRETATION:
The market is in a risk-off regime. Negative trends across multiple horizons and/or
elevated volatility. Flight to safe assets.
Suggested positioning: DEFENSIVE, capital protection.

⚠️ COMMODITIES ALERT: Commodities show elevated volatility. This may
indicate uncertainty about economic growth or unstable supply/demand dynamics.

======================================================================
ASSET RANKING - WHO IS PERFORMING BEST?
======================================================================

🥇 1. Commodities (DBC) - SCORE: 46/100
     Price: $27.75
     Trend: BELOW EMA10 | ABOVE EMA50 | ABOVE EMA200
     Performance: 5d -3.51% | 20d +12.26% | 60d +22.62%
     Volatility: 5d 39.0% | 20d 28.7% | 60d 24.4%
     Drawdown: -5.19%
     → Asset in NEUTRAL conditions: mixed signals

🥈 2. Global Bonds (BND) - SCORE: 30/100
     Price: $73.45
     Trend: BELOW EMA10 | BELOW EMA50 | ABOVE EMA200
     Performance: 5d -0.72% | 20d -1.68% | 60d -0.37%
     Volatility: 5d 7.7% | 20d 4.9% | 60d 3.8%
     Drawdown: -1.99%
     → Asset in WEAK conditions: negative trends or elevated volatility

🥉 3. Global Equities (ACWI) - SCORE: 10/100
     Price: $138.81
     Trend: BELOW EMA10 | BELOW EMA50 | ABOVE EMA200
     Performance: 5d -2.16% | 20d -5.78% | 60d -2.73%
     Volatility: 5d 23.4% | 20d 17.8% | 60d 14.0%
     Drawdown: -6.62%
     → Asset UNDER PRESSURE: avoid or significantly underweight

======================================================================
CORRELATION ANALYSIS - CURRENT vs HISTORICAL
======================================================================

ACWI/BND:
  Current correlation (30d): +0.479
  Historical average (1 year): +0.154
  Deviation: +0.325
  ⚠️ SIGNIFICANT DEVIATION from historical average
  → Positive correlation: diversification COMPROMISED

BND/DBC:
  Current correlation (30d): -0.602
  Historical average (1 year): -0.227
  Deviation: -0.375
  ⚠️ SIGNIFICANT DEVIATION from historical average

ACWI/DBC:
  Current correlation (30d): -0.359
  Historical average (1 year): +0.095
  Deviation: -0.455
  ⚠️ SIGNIFICANT DEVIATION from historical average
  → Negative correlation: possible supply-driven shift

======================================================================
OPERATIONAL SUMMARY
======================================================================

STRONGEST ASSET: Commodities (Score: 46/100)
WEAKEST ASSET: Global Equities (Score: 10/100)

SUGGESTED ACTION: Reduce exposure to the weakest asset, favor defensive positions.
DIVERSIFICATION: GOOD - Diversification benefits present.

======================================================================
Analysis automatically generated by kbmeter.com
Date: 2026-03-24
On the macro front, the day features the preliminary results of March PMI surveys, offering the first indication of how companies are beginning to respond to the energy crisis. Early data suggest more pronounced effects in the services sector. Among other data releases, watch for inflation in Japan, the weekly ADP employment report in the United States, and the final Q4 2025 data on U.S. labor costs.
Already a subscriber? Login here
NOTES AND WARNINGS
Data compiled by kbmeter.com. Analysis date: 24 March 2026 - 7:42 AM GMT+1
This content is provided for informational purposes only and should not be considered financial advice. All scores and assessments are based on the previous trading day’s closing prices. Futures indications refer to the date and time of the analysis.