Markets Struggle for Direction as Earnings, Middle East Deliver Mixed Signals
Financial markets are struggling to find a clear direction, yet they remain in risk-on territory. Uncertainty continues to be the main driver, with this week’s market movers delivering both positive and negative signals. This is evident in the situation in the Middle East, where the Strait of Hormuz remains blocked on one side, while a potential resumption of negotiations over the weekend offers a counterpoint.
A similar dynamic can be seen in the tech sector: Tesla has reported solid earnings but has tempered enthusiasm by highlighting the impact of its investments. Meanwhile, IBM has posted results below expectations, reigniting debate about the impact of AI on the software industry. Overall sentiment remains moderately positive, but volatility continues to be elevated. Futures indicate a lower opening for both Europe and the United States.
Market Weather Map
April 23, 2026
US Equities
Eu Equities
Asia Equities
Commodities
Bonds
Dollar Index
Technology
Gold
Oil
Crypto
Market Summary
Financial markets sentiment
Today, financial markets show a moderately positive sentiment. Intermarket analysis points to a Market Health Score of 58/100 (moderately positive). Our intermarket dashboards confirm the scenario described in previous analyses: investors appear reluctant to take a clear stance, suggesting a wait-and-see approach as they seek greater clarity. Across asset classes, this is reflected in a weakening of the rebound momentum in both equities and bonds. It is also worth noting that the correlation between equities and bonds remains strongly positive, reducing diversification opportunities.

Global futures
Pre-market futures: Global futures signal a risk-off sentiment (average -0.60%), with the US at -0.53%, Europe at -0.64%, and Asia at -0.54%.
📊 Global Futures – Pre-Market Sentiment
- CSI 300: +0.70%
- Mini MDAX derived: +0.00%
- FTSE MIB derived: -0.26%
- Nikkei 225 derived: -1.23%
- Mini DAX: -1.19%
- Euro Stoxx 50 derived: -1.09%
Intermarket details
📄 Detailed Intermarket Analysis
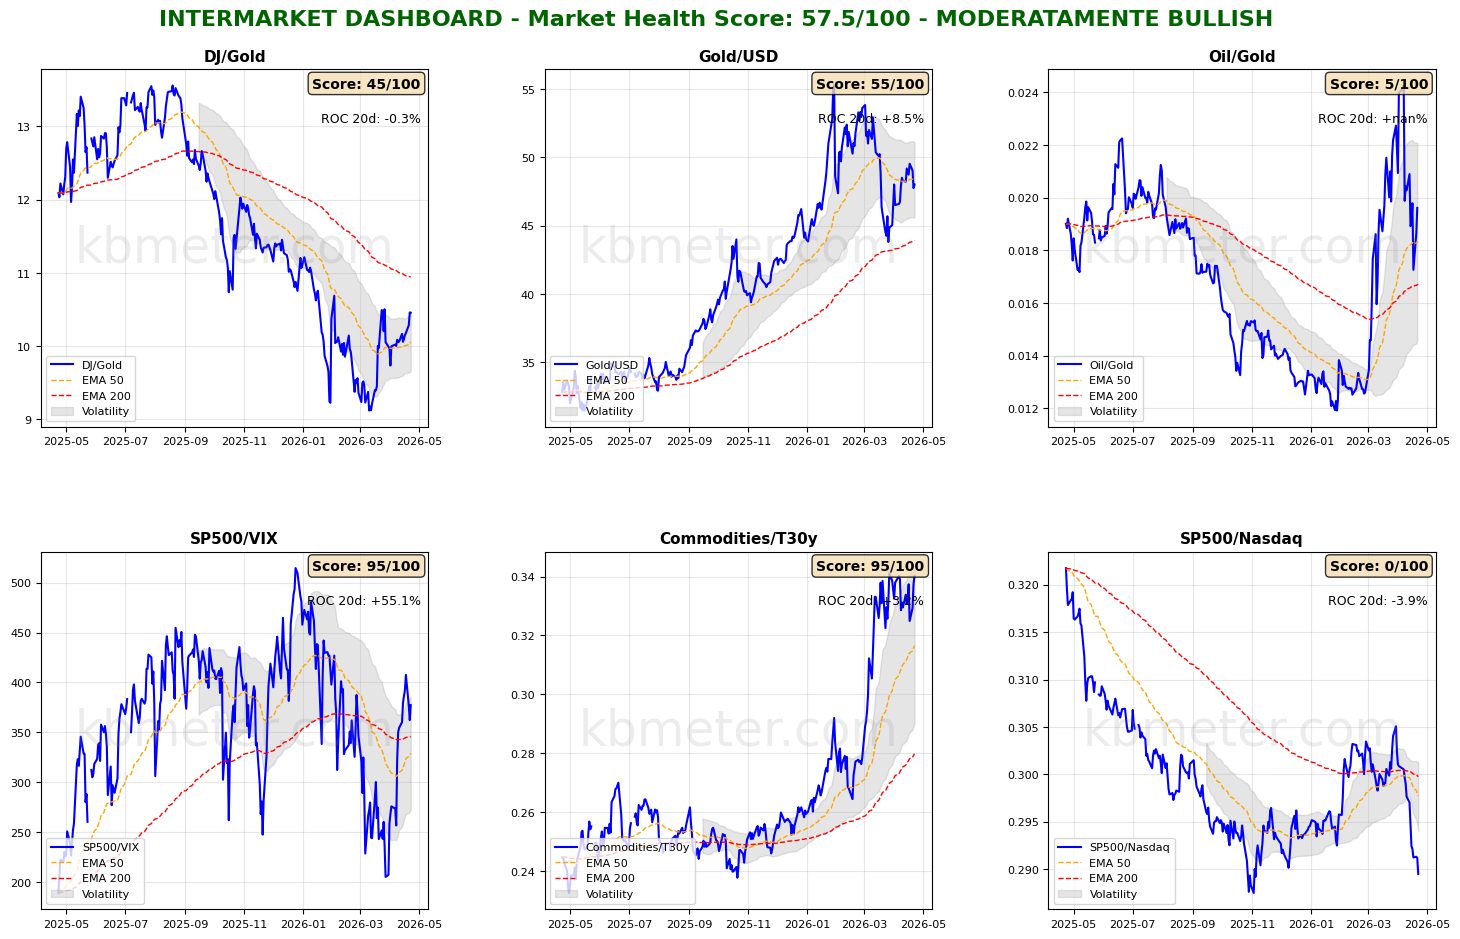
INTERMARKET ANALYSIS - 2026-04-23
============================================================

MARKET HEALTH SCORE: 57.5/100
SENTIMENT: MODERATELY BULLISH

============================================================
SUMMARY OF MAIN RATIOS
============================================================


DJ/Gold:
  - Component score: 45.0/100
  - Current value: 10.4575
  - Position vs EMA50: ABOVE
  - 20-day ROC: -0.26%
  - 50-day ROC: +5.35%
  → Preference for risk assets vs safe haven

Gold/USD:
  - Component score: 55.0/100
  - Current value: 48.0018
  - Position vs EMA50: BELOW
  - 20-day ROC: +8.49%
  - 50-day ROC: -7.99%

Oil/Gold:
  - Component score: 5.0/100
  - Current value: nan
  - Position vs EMA50: BELOW
  - 20-day ROC: +nan%
  - 50-day ROC: +nan%
  → Declining energy demand

SP500/VIX:
  - Component score: 95.0/100
  - Current value: 377.2674
  - Position vs EMA50: ABOVE
  - 20-day ROC: +55.08%
  - 50-day ROC: -5.97%
  → Expanding risk appetite

Commodities/T30y:
  - Component score: 95.0/100
  - Current value: 0.3402
  - Position vs EMA50: ABOVE
  - 20-day ROC: +3.21%
  - 50-day ROC: +21.89%
  → Economic growth expectations

SP500/Nasdaq:
  - Component score: 0.0/100
  - Current value: 0.2895
  - Position vs EMA50: BELOW
  - 20-day ROC: -3.92%
  - 50-day ROC: -3.41%
  - ⚠️ ANOMALY DETECTED - Significant deviation from the average

============================================================
CONCLUSIONS AND RECOMMENDATIONS
============================================================

The market is moderately constructive. Some ratios show positive signals
but elements of caution remain. Monitor developments.
Positioning: SELECTIVE, favor quality.


STRONGEST RATIOS:
  • SP500/VIX: 95.0/100
  • Commodities/T30y: 95.0/100
  • Gold/USD: 55.0/100

WEAKEST RATIOS:
  • DJ/Gold: 45.0/100
  • Oil/Gold: 5.0/100
  • SP500/Nasdaq: 0.0/100

============================================================
Analysis automatically generated by kbmeter.com
Date: 2026-04-23
📄 Detailed Asset Allocation Analysis
ASSET ALLOCATION & REGIME ANALYSIS - 2026-04-23
======================================================================

MARKET REGIME: RISK-ON
REGIME SCORE: 80.0/100

======================================================================
TREND AND VOLATILITY ANALYSIS
======================================================================

GLOBAL EQUITIES (ACWI):
  Short-Term Trend (5d): +0.85% | ABOVE EMA 10
  Medium-Term Trend (20d): +7.77% | ABOVE EMA 50
  Long-Term Trend (60d): +2.11% | ABOVE EMA 200

  Volatility 5d: 15.7%
  Volatility 20d: 20.3%
  Volatility 60d: 17.6%

COMMODITIES (DBC):
  Medium-Term Trend (20d): +4.76% | ABOVE EMA 50
  Volatility 20d: 22.8%

ACWI/BND Correlation (30d): 0.708

REGIME INTERPRETATION:
The market is in a risk-on regime. Equities show positive trends across multiple
time horizons and volatility remains contained. Investors favor risk assets.
Suggested positioning: OVERWEIGHT equities.

======================================================================
ASSET RANKING - WHO IS PERFORMING BEST?
======================================================================

🥇 1. Global Equities (ACWI) - SCORE: 100/100
     Price: $150.17
     Trend: ABOVE EMA10 | ABOVE EMA50 | ABOVE EMA200
     Performance: 5d +0.85% | 20d +7.77% | 60d +2.11%
     Volatility: 5d 15.7% | 20d 20.3% | 60d 17.6%
     Drawdown: -0.48%
     → Asset in STRONG HEALTH: positive trends and controlled volatility

🥈 2. Global Bonds (BND) - SCORE: 100/100
     Price: $73.86
     Trend: ABOVE EMA10 | ABOVE EMA50 | ABOVE EMA200
     Performance: 5d +0.12% | 20d +0.78% | 60d +0.41%
     Volatility: 5d 4.3% | 20d 4.1% | 60d 4.2%
     Drawdown: -1.11%
     → Asset in STRONG HEALTH: positive trends and controlled volatility

🥉 3. Commodities (DBC) - SCORE: 100/100
     Price: $29.51
     Trend: ABOVE EMA10 | ABOVE EMA50 | ABOVE EMA200
     Performance: 5d +1.37% | 20d +4.76% | 60d +19.86%
     Volatility: 5d 29.7% | 20d 22.8% | 60d 26.6%
     Drawdown: 0.00%
     → Asset in STRONG HEALTH: positive trends and controlled volatility

======================================================================
CORRELATION ANALYSIS - CURRENT vs HISTORICAL
======================================================================

ACWI/BND:
  Current correlation (30d): +0.708
  Historical average (1 year): +0.192
  Deviation: +0.516
  ⚠️ SIGNIFICANT DEVIATION from historical average
  → Positive correlation: diversification COMPROMISED

BND/DBC:
  Current correlation (30d): -0.484
  Historical average (1 year): -0.276
  Deviation: -0.208

ACWI/DBC:
  Current correlation (30d): -0.649
  Historical average (1 year): -0.004
  Deviation: -0.645
  ⚠️ SIGNIFICANT DEVIATION from historical average
  → Negative correlation: possible supply-driven shift

======================================================================
OPERATIONAL SUMMARY
======================================================================

STRONGEST ASSET: Global Equities (Score: 100/100)
WEAKEST ASSET: Commodities (Score: 100/100)

SUGGESTED ACTION: Favor the strongest asset, maintain risk exposure.
DIVERSIFICATION: WEAK - Asset classes tend to move together.

======================================================================
Analysis automatically generated by kbmeter.com
Date: 2026-04-23
The macroeconomic calendar
The macroeconomic calendar is marked by the release of the flash estimate of April PMI surveys, a key data point for understanding how the energy crisis is evolving and spreading within the manufacturing sector. Attention should also be paid to the March CFNAI index and US jobless claims. On the earnings front, today features reports from Intel, Sanofi, American Express, and Nestlé.
Already a subscriber? Login here
NOTES AND WARNINGS
Data compiled by kbmeter.com. Analysis date: 23 April 2026 - 7:44 AM GMT+1
This content is provided for informational purposes only and should not be considered financial advice. All scores and assessments are based on the previous trading day’s closing prices. Futures indications refer to the date and time of the analysis.