Markets Start Week on Uncertain Footing as China Data and Inflation Risks Weigh
Inflation has moved back to the center of the debate and appears to have overtaken even the appeal of the technology sector in investors’ minds. Weaker-than-expected Chinese economic data and persistent tensions in the Middle East further complicate an environment that nevertheless remains moderately risk-on, with declining volatility. Futures point to a negative opening for both Europe and the United States.
Key Signals — May 18, 2026
- Bonds under pressure (score 43.55 · −12.91 signed): down 7.3 points over the past seven days. The Commodity/Bond ratio at the 97.5th percentile signals a persistent reflationary environment that continues to structurally penalize fixed income.
- US dollar accelerating abnormally (score 64.67 · +29.33 signed): over the last seven days, the Dollar Index gained 19.5 score points — a move in the 98th historical percentile. The Gold/Dollar ratio signals extreme currency dominance.
- China slows in April (industrial production +4.1% YoY vs +5.9% expected; retail sales +0.2% vs +2.0% expected): consumer data came in at the weakest level since 2022. Asian futures have already priced in the disappointment, with Asia Equities down 4.8 points over seven days.
Market Weather Map
May 18, 2026
US Equities
Eu Equities
Asia Equities
Commodities
Bonds
Dollar Index
Technology
Gold
Oil
Crypto
Market Summary
Financial markets sentiment
Financial markets currently show a moderately positive sentiment. Intermarket analysis highlights a Market Health Score of 66/100, indicating a positive backdrop.
The broader environment still points to expansion — with a risk-on index at 0.71, declining volatility, and equity markets above 50 across all three major regions — but the surface-level reading conceals three divergences that deserve close attention.
The Dollar Index at 64.67, combined with a weekly increase of 19.5 points, is the loudest signal. At this level of strength and speed, recent history suggests mounting pressure on dollar-denominated commodities and emerging market assets.
Oil remains the exception that proves the rule. With a score of 59.78 and a positive seven-day delta of +8.4 points, oil is rising alongside the dollar — a configuration that reflects the geopolitical risk premium linked to the conflict in the Middle East.
Fixed income remains the structurally weakest area of the system. A score of 43.55 and a weekly delta of −7.3 points indicate that bonds continue to lose ground in a persistently reflationary environment — confirmed by the Commodity/Bond ratio reaching period highs.
Global Futures – Pre-Market Sentiment
Pre-Market Futures: Global futures indicate a risk-off sentiment (average −0.98%), with the US negative (−0.76%), Europe negative (−0.97%), and Asia sharply lower (−1.29%). The FTSE MIB and CAC 40 are leading European losses, with declines nearly double the US average — a sign that markets view Europe as more exposed to deteriorating Chinese data and dollar strength. The only partially positive note comes from the FTSE 100 at −0.08%, supported by the heavy weighting of commodity companies in the London index, which are benefiting from stronger oil prices. In Asia, dispersion remains limited: all three major indices are lower, with the CSI 300 leading declines in line with weaker domestic macroeconomic data.
📊 Global Futures – Pre-Market Sentiment
- Mini MDAX derived: +0.00%
- FTSE 100 derived: -0.08%
- US Tech 100 derived: -0.62%
- FTSE MIB derived: -1.92%
- CSI 300: -1.86%
- CAC 40 derived: -1.66%
Intermarket details
📄 Detailed Intermarket Analysis
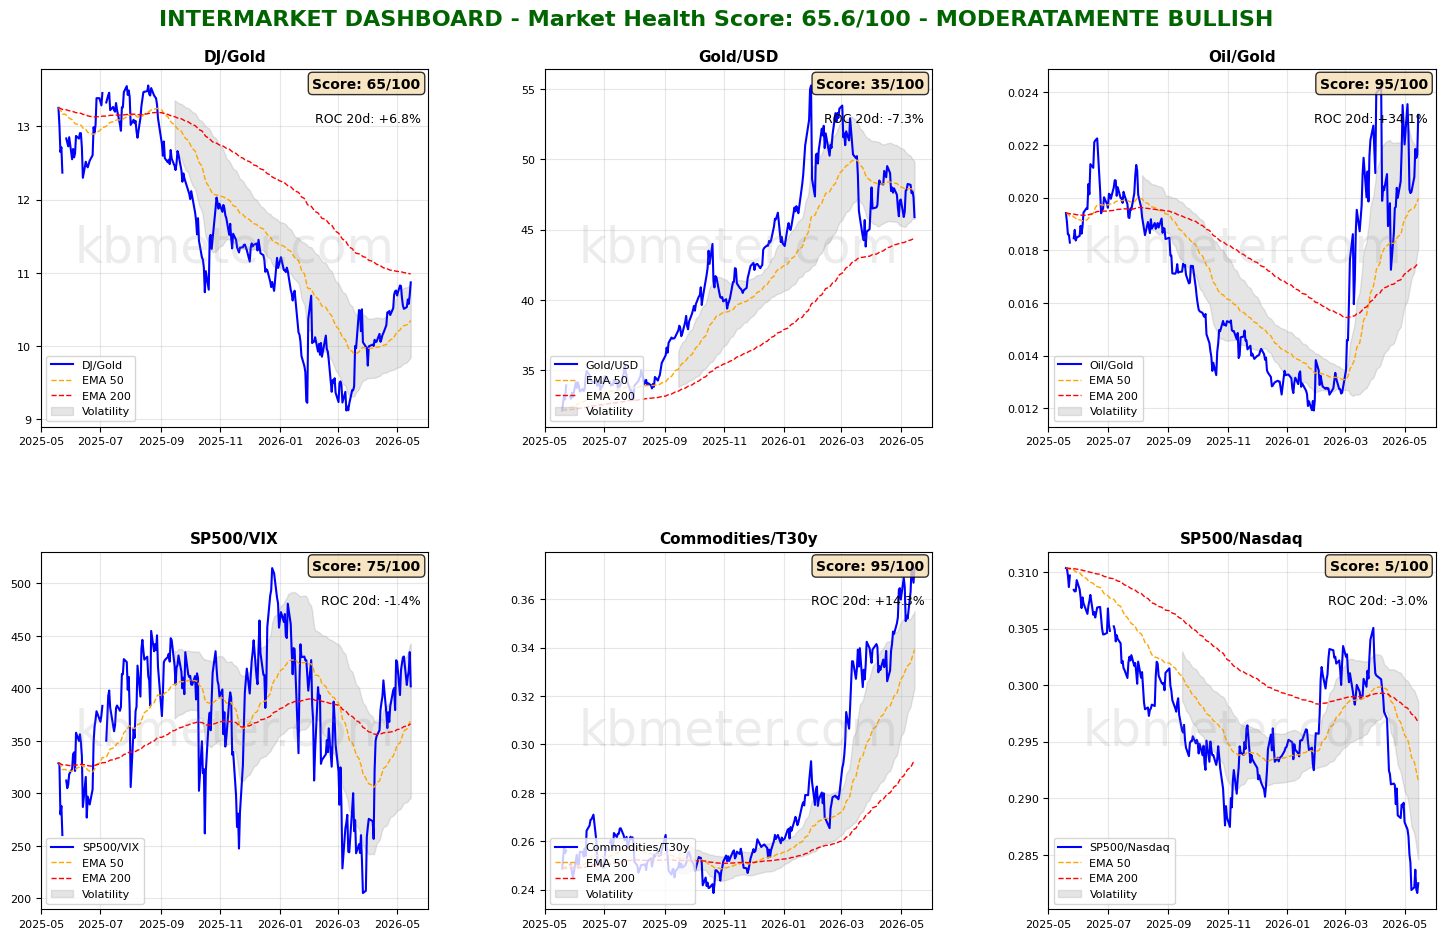
INTERMARKET ANALYSIS - 2026-05-18
============================================================

MARKET HEALTH SCORE: 65.6/100
SENTIMENT: MODERATELY BULLISH

============================================================
SUMMARY OF KEY RATIOS
============================================================


DJ/Gold:
  - Component score: 65.0/100
  - Current value: 10.8710
  - Position vs EMA50: ABOVE
  - 20-day ROC: +6.79%
  - 50-day ROC: +14.83%
  → Preference for risk assets over safe havens

Gold/USD:
  - Component score: 35.0/100
  - Current value: 45.8930
  - Position vs EMA50: BELOW
  - 20-day ROC: -7.32%
  - 50-day ROC: -10.01%

Oil/Gold:
  - Component score: 95.0/100
  - Current value: 0.0231
  - Position vs EMA50: ABOVE
  - 20-day ROC: +34.05%
  - 50-day ROC: +44.69%
  → Rising energy demand

SP500/VIX:
  - Component score: 75.0/100
  - Current value: 401.9805
  - Position vs EMA50: ABOVE
  - 20-day ROC: -1.40%
  - 50-day ROC: +39.77%

Commodities/T30y:
  - Component score: 95.0/100
  - Current value: 0.3728
  - Position vs EMA50: ABOVE
  - 20-day ROC: +14.32%
  - 50-day ROC: +23.87%
  → Expectations of economic growth

SP500/Nasdaq:
  - Component score: 5.0/100
  - Current value: 0.2825
  - Position vs EMA50: BELOW
  - 20-day ROC: -3.00%
  - 50-day ROC: -5.92%

============================================================
CONCLUSIONS AND RECOMMENDATIONS
============================================================

The market remains moderately constructive. Some ratios continue to show positive signals,
but elements of caution persist. Monitor developments closely.
Positioning: SELECTIVE, favoring quality.


STRONGEST RATIOS:
  • Oil/Gold: 95.0/100
  • Commodities/T30y: 95.0/100
  • SP500/VIX: 75.0/100

WEAKEST RATIOS:
  • DJ/Gold: 65.0/100
  • Gold/USD: 35.0/100
  • SP500/Nasdaq: 5.0/100

============================================================
Analysis automatically generated by kbmeter.com
Date: 2026-05-18
📄 Detailed Asset Allocation Analysis
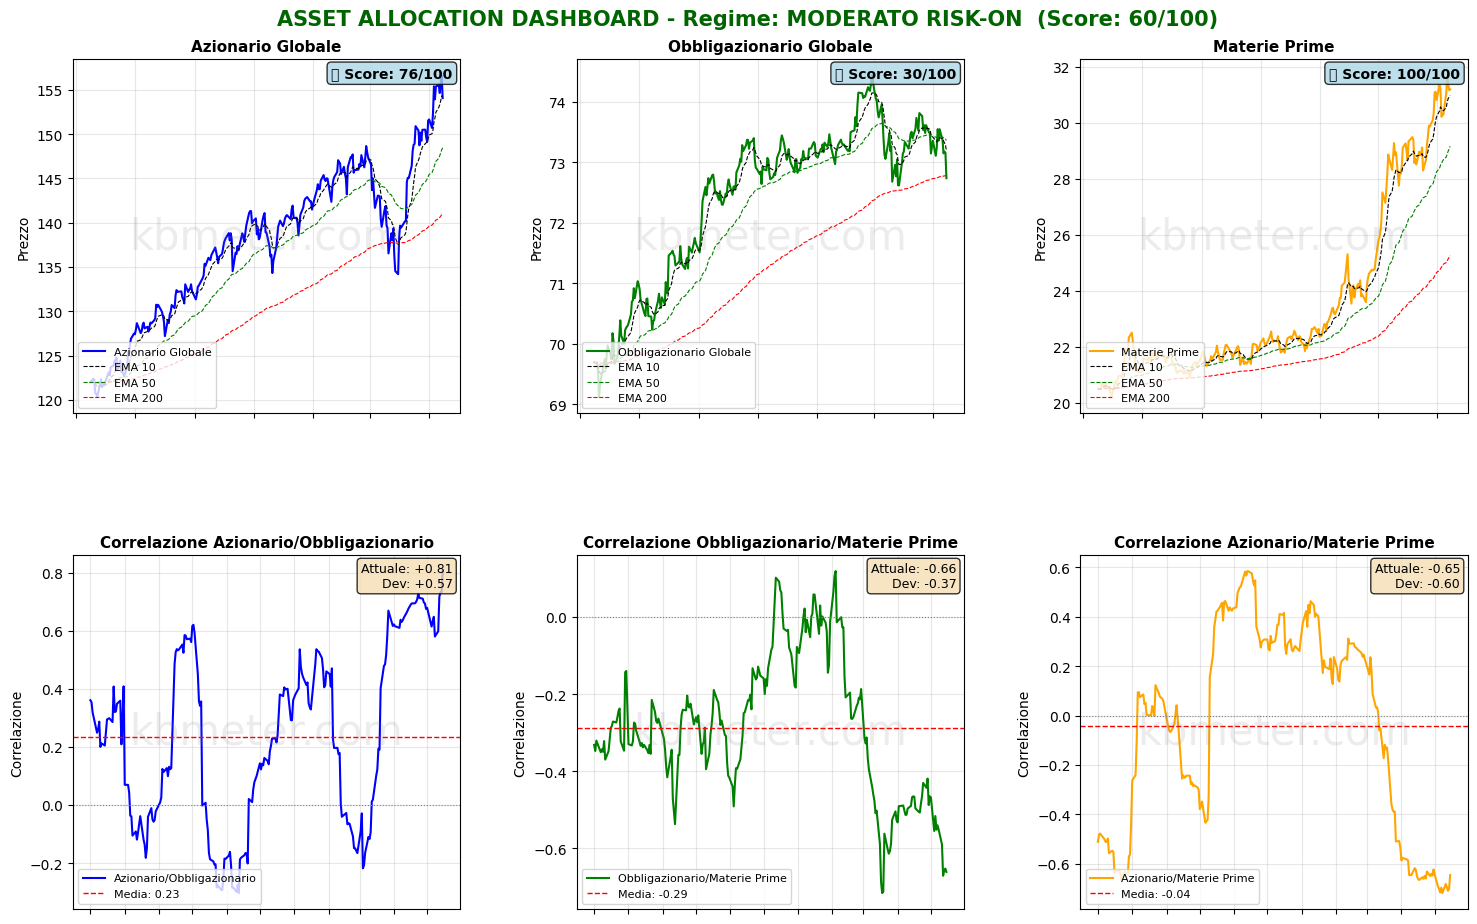
ASSET ALLOCATION & REGIME ANALYSIS - 2026-05-18
======================================================================

MARKET REGIME: MODERATE RISK-ON
REGIME SCORE: 60.0/100

======================================================================
TREND AND VOLATILITY ANALYSIS
======================================================================

GLOBAL EQUITIES (ACWI):
  Short-Term Trend (5d): -0.93% | BELOW EMA 10
  Medium-Term Trend (20d): +2.44% | ABOVE EMA 50
  Long-Term Trend (60d): +4.37% | ABOVE EMA 200

  5d Volatility: 15.4%
  20d Volatility: 15.2%
  60d Volatility: 18.1%

COMMODITIES (DBC):
  Medium-Term Trend (20d): +8.79% | ABOVE EMA 50
  20d Volatility: 21.9%

ACWI/BND Correlation (30d): 0.805

REGIME INTERPRETATION:
The market shows a willingness to take risk, but with some elements of caution.
The trend remains constructive, although conflicting signals may emerge across certain time horizons.
Suggested positioning: BALANCED with a slight tilt toward risk assets.

======================================================================
ASSET RANKING - WHICH IS PERFORMING BEST?
======================================================================

🥇 1. Commodities (DBC) - SCORE: 100/100
     Price: $31.19
     Trend: ABOVE EMA10 | ABOVE EMA50 | ABOVE EMA200
     Performance: 5d +0.42% | 20d +8.79% | 60d +26.79%
     Volatility: 5d 25.3% | 20d 21.9% | 60d 24.2%
     Drawdown: -1.58%
     → Asset in STRONG HEALTH: positive trends and controlled volatility

🥈 2. Global Equities (ACWI) - SCORE: 76/100
     Price: $154.08
     Trend: BELOW EMA10 | ABOVE EMA50 | ABOVE EMA200
     Performance: 5d -0.93% | 20d +2.44% | 60d +4.37%
     Volatility: 5d 15.4% | 20d 15.2% | 60d 18.1%
     Drawdown: -1.64%
     → Asset in STRONG HEALTH: positive trends and controlled volatility

🥉 3. Global Bonds (BND) - SCORE: 30/100
     Price: $72.74
     Trend: BELOW EMA10 | BELOW EMA50 | BELOW EMA200
     Performance: 5d -0.86% | 20d -1.39% | 60d -1.82%
     Volatility: 5d 3.9% | 20d 4.1% | 60d 4.5%
     Drawdown: -2.29%
     → Asset in WEAK CONDITIONS: negative trends or elevated volatility

======================================================================
CORRELATION ANALYSIS - CURRENT vs HISTORICAL
======================================================================

ACWI/BND:
  Current Correlation (30d): +0.805
  Historical Average (1 year): +0.234
  Deviation: +0.571
  ⚠️ SIGNIFICANT DEVIATION from historical average
  → Positive correlation: diversification COMPROMISED

BND/DBC:
  Current Correlation (30d): -0.661
  Historical Average (1 year): -0.288
  Deviation: -0.373
  ⚠️ SIGNIFICANT DEVIATION from historical average

ACWI/DBC:
  Current Correlation (30d): -0.645
  Historical Average (1 year): -0.041
  Deviation: -0.604
  ⚠️ SIGNIFICANT DEVIATION from historical average
  → Negative correlation: possible supply-driven shift

======================================================================
OPERATIONAL SUMMARY
======================================================================

STRONGEST ASSET: Commodities (Score: 100/100)
WEAKEST ASSET: Global Bonds (Score: 30/100)

SUGGESTED ACTION: Favor the strongest asset while maintaining risk exposure.
DIVERSIFICATION: POOR - Asset classes tend to move together.

======================================================================
Analysis automatically generated by kbmeter.com
Date: 2026-05-18
Already a subscriber? Login here
NOTES AND WARNINGS
Data compiled by kbmeter.com. Analysis date: 18 May 2026 - 7:46 AM GMT+1
This content is provided for informational purposes only and should not be considered financial advice. All scores and assessments are based on the previous trading day’s closing prices. Futures indications refer to the date and time of the analysis.