Markets Open Week on Iran Escalation Fears as Big U.S. Banks Kick Off Earnings
We left off at the end of last week with financial markets full of optimism regarding a potential U.S.–Iran negotiation. We now find ourselves at the start of a particularly important week, marked by the failure of the Islamabad summit and a renewed surge in oil prices.
Investor sentiment, which had turned positive after several weeks, now risks slipping back into crisis territory, amid the threat of a new escalation, the likely exchange of harsh statements between the parties at war, and—crucially—the arrival of the first Q1 2026 earnings reports. This is the week of the major banks’ earnings. Futures indicate a weak opening for Europe and a negative one for the U.S. Volatility remains very high.
Market Weather Map
April 13, 2026
US Equities
Eu Equities
Asia Equities
Commodities
Bonds
Dollar Index
Technology
Gold
Oil
Crypto
Market Summary
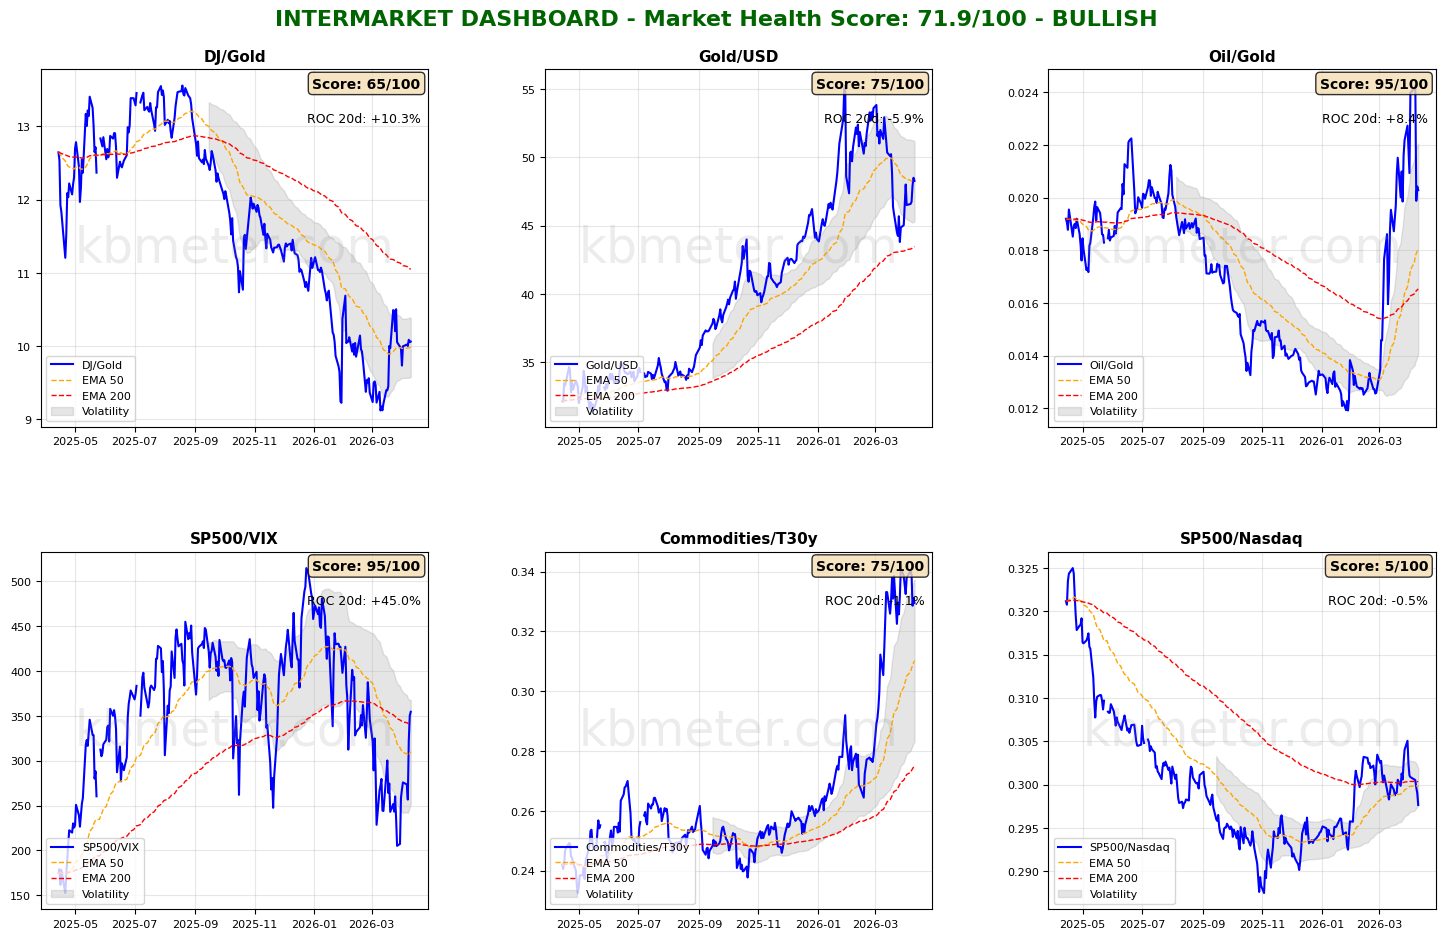
Financial markets currently show a neutral to moderately positive sentiment. Intermarket analysis points to a Market Health Score of 72/100 (positive). Intermarket dashboards reflect the legacy of a weekend driven by hope—a situation likely to face a sharp setback following the failure of the first round of negotiations between the U.S. and Iran. Despite improvements in risk indicators, we had highlighted how Oil/Gold and Commodities/Treasury ratios continued to signal an environment of uncertainty. It is in this context that the new week begins.
From an asset class perspective, we return to monitoring medium- and long-term moving averages, this time as potential support levels in the event of corrections in both equity markets and global fixed income. The correlation between the two remains strong and positive.
In our “weather map,” we highlight the recovery of the tech sector—an interesting development ahead of the upcoming earnings season.
Pre-market futures: Global futures point to a moderate risk-off sentiment (average -0.39%), with the U.S. negative (-0.89%), Europe slightly negative (-0.15%), and Asia slightly negative (-0.45%).
📊 Global Futures – Pre-Market Sentiment
- CSI 300: +1.67%
- Euro Stoxx 50 derived: +0.96%
- TecDAX derived: +0.75%
- Nikkei 225 derived: -1.61%
- Mini DAX: -1.52%
- DAX derived: -1.48%
📄 Detailed Intermarket Analysis
INTERMARKET ANALYSIS - 2026-04-13
============================================================

MARKET HEALTH SCORE: 71.9/100
SENTIMENT: BULLISH

============================================================
SUMMARY OF KEY RATIOS
============================================================


DJ/Gold:
  - Component score: 65.0/100
  - Current value: 10.0625
  - Position vs EMA50: ABOVE
  - 20-day ROC: +10.28%
  - 50-day ROC: +8.84%
  → Preference for risk assets vs safe haven

Gold/USD:
  - Component score: 75.0/100
  - Current value: 48.2707
  - Position vs EMA50: ABOVE
  - 20-day ROC: -5.89%
  - 50-day ROC: -12.18%

Oil/Gold:
  - Component score: 95.0/100
  - Current value: 0.0203
  - Position vs EMA50: ABOVE
  - 20-day ROC: +8.37%
  - 50-day ROC: +70.09%
  → Rising energy demand

SP500/VIX:
  - Component score: 95.0/100
  - Current value: 354.4925
  - Position vs EMA50: ABOVE
  - 20-day ROC: +44.98%
  - 50-day ROC: -16.94%
  → Expanding risk appetite

Commodities/T30y:
  - Component score: 75.0/100
  - Current value: 0.3295
  - Position vs EMA50: ABOVE
  - 20-day ROC: -1.09%
  - 50-day ROC: +14.46%
  → Economic growth expectations

SP500/Nasdaq:
  - Component score: 5.0/100
  - Current value: 0.2976
  - Position vs EMA50: BELOW
  - 20-day ROC: -0.47%
  - 50-day ROC: +1.76%

============================================================
CONCLUSIONS AND RECOMMENDATIONS
============================================================

The market shows widespread signs of strength. Intermarket ratios suggest
a risk-friendly environment. High risk appetite and positive trends.
Positioning: CONSTRUCTIVE on risk assets.


STRONGEST RATIOS:
  • Oil/Gold: 95.0/100
  • SP500/VIX: 95.0/100
  • Gold/USD: 75.0/100

WEAKEST RATIOS:
  • Commodities/T30y: 75.0/100
  • DJ/Gold: 65.0/100
  • SP500/Nasdaq: 5.0/100

============================================================
Analysis automatically generated by kbmeter.com
Date: 2026-04-13
📄 Detailed Asset Allocation Analysis
ASSET ALLOCATION & REGIME ANALYSIS - 2026-04-13
======================================================================
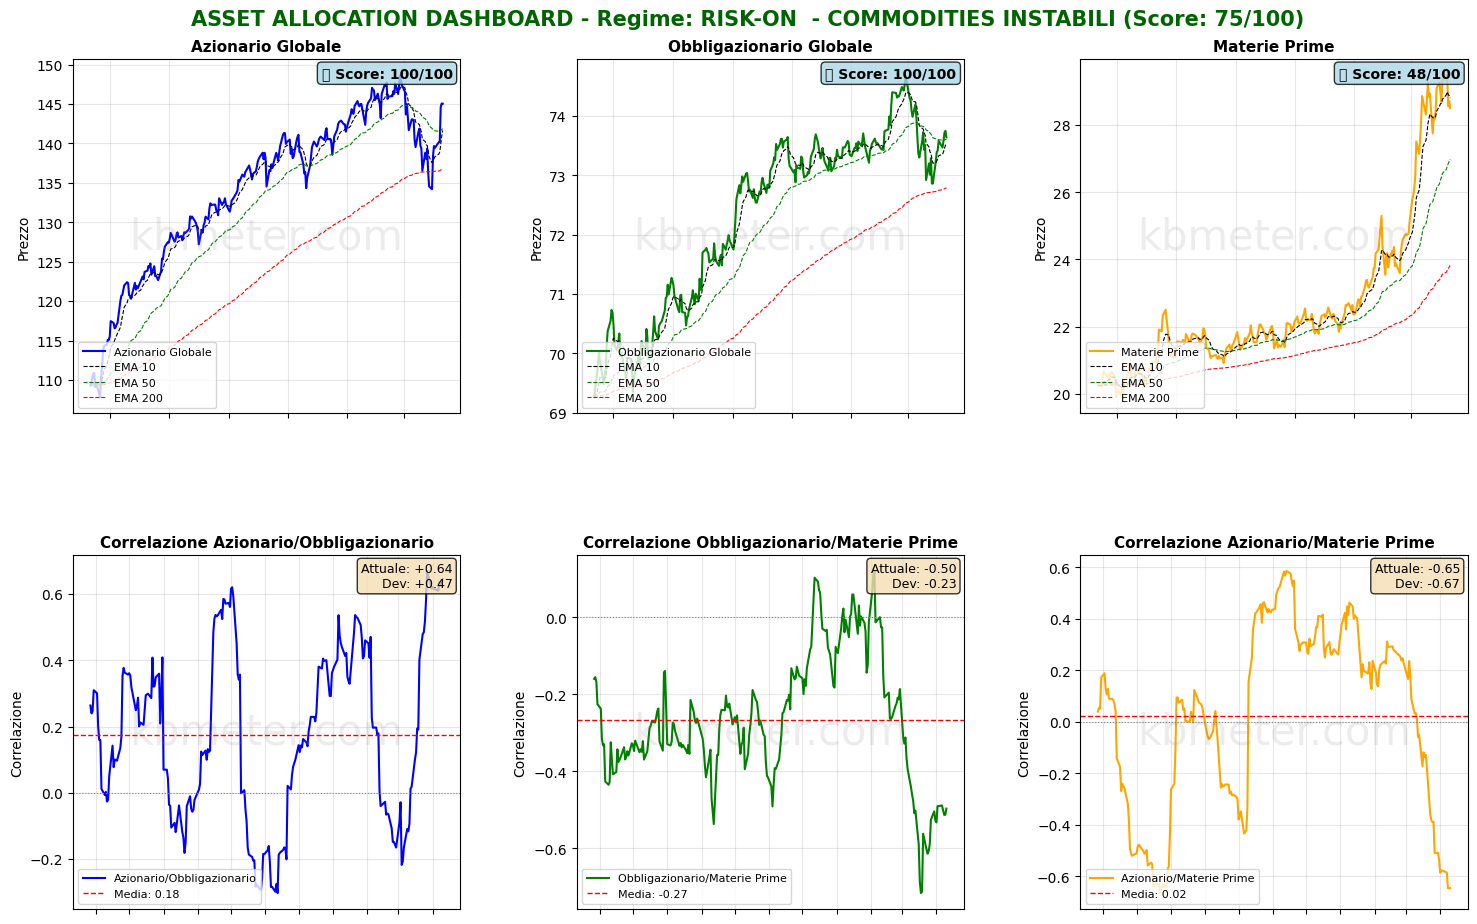
MARKET REGIME: RISK-ON - UNSTABLE COMMODITIES
REGIME SCORE: 75.0/100
======================================================================
TREND AND VOLATILITY ANALYSIS
======================================================================
GLOBAL EQUITIES (ACWI):
Short-Term Trend (5d): +3.49% | ABOVE EMA 10
Medium-Term Trend (20d): +3.94% | ABOVE EMA 50
Long-Term Trend (60d): +0.23% | ABOVE EMA 200
Volatility 5d: 21.2%
Volatility 20d: 22.9%
Volatility 60d: 17.5%
COMMODITIES (DBC):
Medium-Term Trend (20d): -0.73% | ABOVE EMA 50
Volatility 20d: 26.5%
ACWI/BND Correlation (30d): 0.645
REGIME INTERPRETATION:
The market is in a risk-on regime. Equities show positive trends across multiple
time horizons and volatility remains contained. Investors favor risk assets.
Suggested positioning: OVERWEIGHT equities.
⚠️ COMMODITIES ALERT: Commodities show elevated volatility. This may
indicate uncertainty around economic growth or unstable supply/demand dynamics.
======================================================================
ASSET RANKING - WHO IS PERFORMING BEST?
======================================================================
🥇 1. Global Equities (ACWI) - SCORE: 100/100
Price: $145.04
Trend: ABOVE EMA10 | ABOVE EMA50 | ABOVE EMA200
Performance: 5d +3.49% | 20d +3.94% | 60d +0.23%
Volatility: 5d 21.2% | 20d 22.9% | 60d 17.5%
Drawdown: -2.43%
→ Asset in STRONG HEALTH: positive trends and controlled volatility
🥈 2. Global Bonds (BND) - SCORE: 100/100
Price: $73.64
Trend: ABOVE EMA10 | ABOVE EMA50 | ABOVE EMA200
Performance: 5d +0.23% | 20d +0.46% | 60d -0.09%
Volatility: 5d 2.6% | 20d 5.4% | 60d 4.1%
Drawdown: -1.40%
→ Asset in STRONG HEALTH: positive trends and controlled volatility
🥉 3. Commodities (DBC) - SCORE: 48/100
Price: $28.50
Trend: BELOW EMA10 | ABOVE EMA50 | ABOVE EMA200
Performance: 5d -3.32% | 20d -0.73% | 60d +21.85%
Volatility: 5d 21.3% | 20d 26.5% | 60d 25.7%
Drawdown: -3.32%
→ Asset in NEUTRAL condition: mixed signals
======================================================================
CORRELATION ANALYSIS - CURRENT vs HISTORICAL
======================================================================
ACWI/BND:
Current correlation (30d): +0.645
Historical average (1 year): +0.176
Deviation: +0.469
⚠️ SIGNIFICANT DEVIATION from historical average
→ Positive correlation: diversification COMPROMISED
BND/DBC:
Current correlation (30d): -0.497
Historical average (1 year): -0.266
Deviation: -0.230
ACWI/DBC:
Current correlation (30d): -0.645
Historical average (1 year): +0.023
Deviation: -0.668
⚠️ SIGNIFICANT DEVIATION from historical average
→ Negative correlation: possible supply-driven shift
======================================================================
OPERATIONAL SUMMARY
======================================================================
STRONGEST ASSET: Global Equities (Score: 100/100)
WEAKEST ASSET: Commodities (Score: 48/100)
SUGGESTED ACTION: Favor the strongest asset, maintain risk exposure.
DIVERSIFICATION: GOOD - Diversification benefits present.
======================================================================
Analysis automatically generated by kbmeter.com
Date: 2026-04-13
On the macro front, the day appears light in terms of major market movers. Noteworthy are India’s March inflation data and U.S. existing home sales for March 2026.
As for earnings, the first 2026 results are now starting to come in. Today it’s Goldman Sachs’ turn, the first of the major U.S. banks to release its first-quarter results.
Already a subscriber? Login here
NOTES AND WARNINGS
Data compiled by kbmeter.com. Analysis date: 13 April 2026 - 7:31 AM GMT+1
This content is provided for informational purposes only and should not be considered financial advice. All scores and assessments are based on the previous trading day’s closing prices. Futures indications refer to the date and time of the analysis.