Markets Hold Firm as Middle East Deal Hopes, Solid Earnings and Softer U.S. PPI Support Sentiment
Financial markets continue with a moderately positive sentiment, supported by a return of risk-on appetite driven by confidence in a potential agreement in the Middle East and the absence of further negative news regarding the Strait of Hormuz. Additional confidence came from U.S. March producer inflation data, which rose well below expectations. Volatility remains elevated (it takes little to shift the overall picture), while among asset classes gold is recovering and the dollar is losing strength.
Meanwhile, earnings season for major U.S. banks continues with few setbacks (Wells Fargo’s revenue figures being the only blemish so far), and attention is shifting to the tech sector with ASML’s (semiconductors) results. Futures indicate a broadly positive opening for Europe and a flat start for the United States.
Market Weather Map
April 15, 2026
US Equities
Eu Equities
Asia Equities
Commodities
Bonds
Dollar Index
Technology
Gold
Oil
Crypto
Market Summary
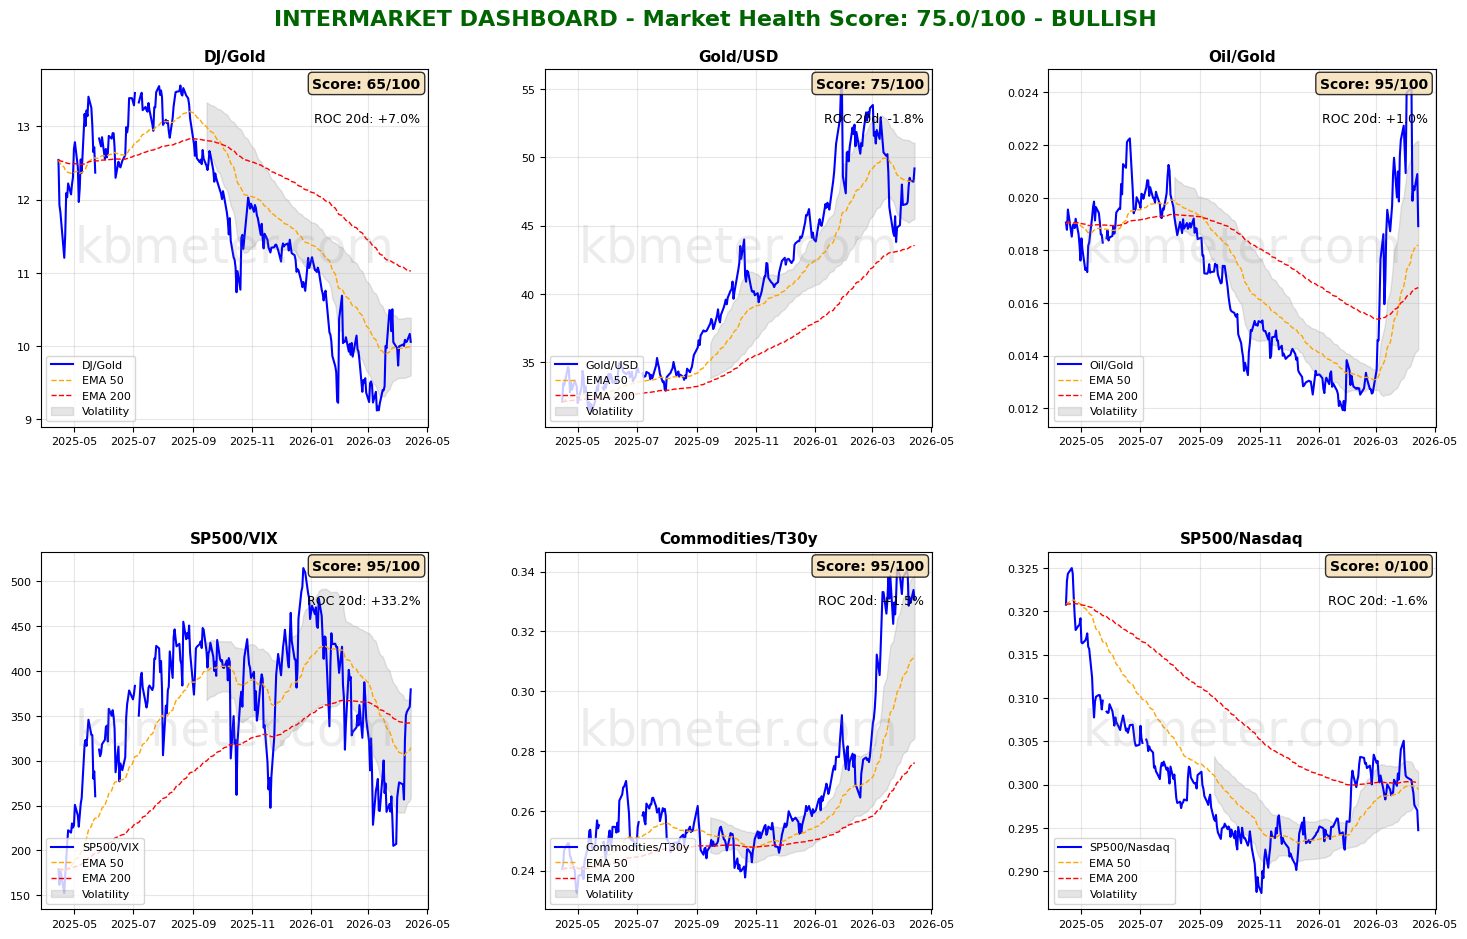
Financial markets today show a moderately positive sentiment. Intermarket analysis highlights a Market Health Score of 75/100 (positive). Our intermarket dashboards confirm two key elements: strengthening risk appetite indicators on one side and the recovery of gold on the other. The S&P/VIX ratio has moved back above its long-term moving average, while the recovery in the technology sector continues, with the S&P/Nasdaq returning to levels seen last January. Gold is outperforming oil, the dollar, and the Dow.
Our “weather map” shows that the strongest movements are concentrated in equities, while the only asset scoring below 50 points is the dollar.
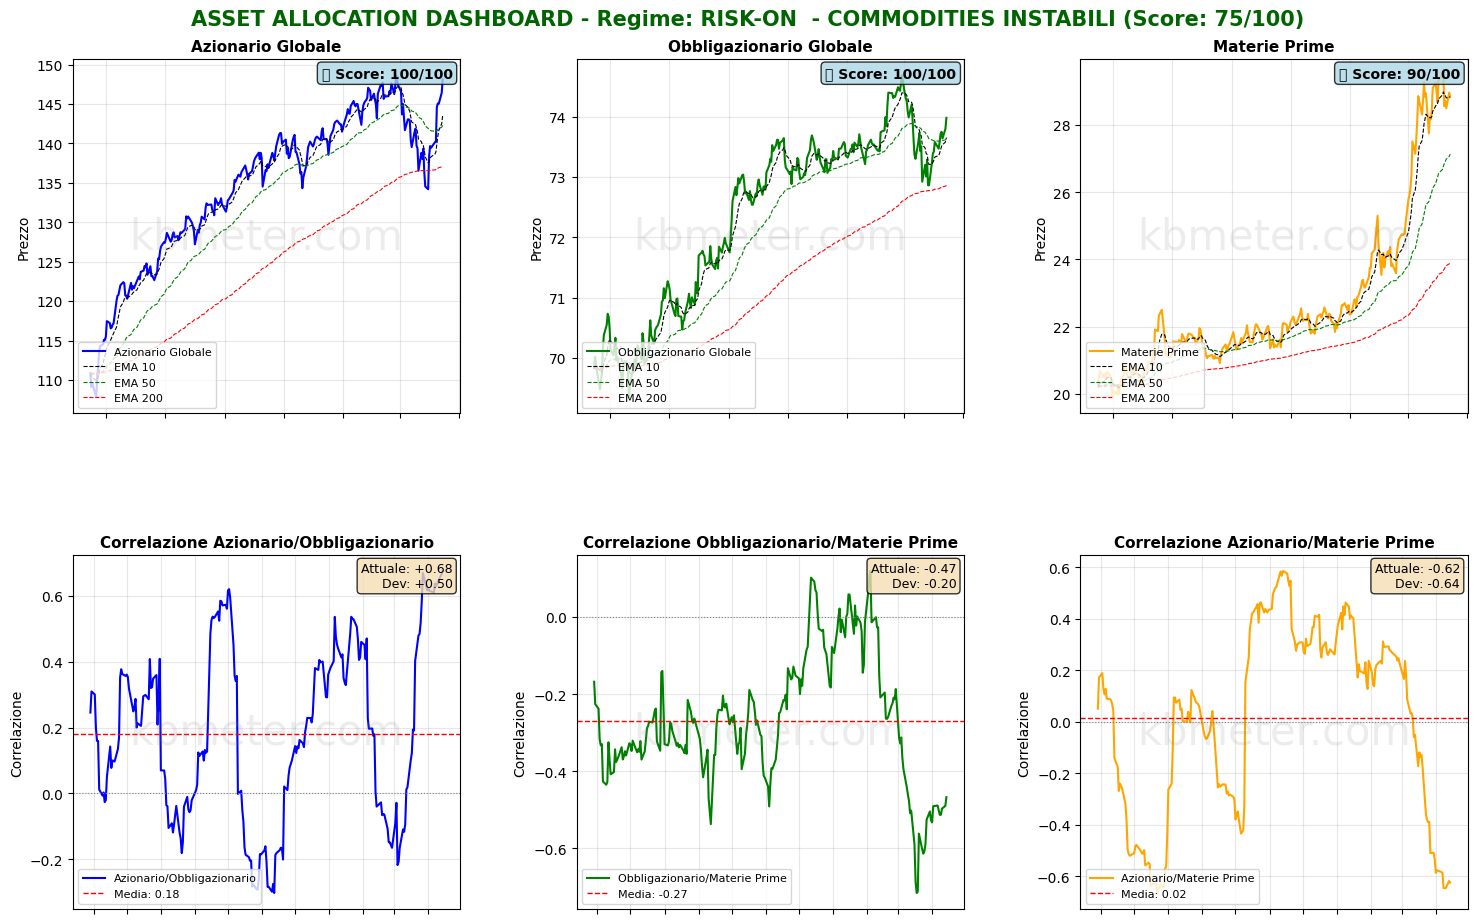
On the asset class front, there are no major changes compared to yesterday: charts show a strong rebound characterizing both global equities and global bonds, while commodities are experiencing a phase of consolidation near the highs reached in recent weeks.
Pre-market futures: Global futures signal a moderately risk-on sentiment (average +0.25%), with the U.S. slightly negative (-0.01%), Europe slightly positive (+0.45%), and Asia slightly negative (-0.01%).
📊 Global Futures – Pre-Market Sentiment
- FTSE MIB derived: +1.39%
- TecDAX derived: +1.21%
- CAC 40 derived: +1.10%
- Nikkei 225 derived: -0.64%
- Hang Seng derived: -0.42%
- Mini DAX: -0.13%
📄 Detailed Intermarket Analysis
INTERMARKET ANALYSIS - 2026-04-15
============================================================

MARKET HEALTH SCORE: 75.0/100
SENTIMENT: BULLISH

============================================================
SUMMARY OF MAIN RATIOS
============================================================


DJ/Gold:
  - Component score: 65.0/100
  - Current value: 10.0593
  - Position vs EMA50: ABOVE
  - 20-day ROC: +7.01%
  - 50-day ROC: -3.01%
  → Preference for risk assets vs safe haven

Gold/USD:
  - Component score: 75.0/100
  - Current value: 49.1745
  - Position vs EMA50: ABOVE
  - 20-day ROC: -1.82%
  - 50-day ROC: +1.18%

Oil/Gold:
  - Component score: 95.0/100
  - Current value: 0.0189
  - Position vs EMA50: ABOVE
  - 20-day ROC: +1.05%
  - 50-day ROC: +36.76%
  → Increasing energy demand

SP500/VIX:
  - Component score: 95.0/100
  - Current value: 379.4869
  - Position vs EMA50: ABOVE
  - 20-day ROC: +33.17%
  - 50-day ROC: -4.62%
  → Expanding risk appetite

Commodities/T30y:
  - Component score: 95.0/100
  - Current value: 0.3307
  - Position vs EMA50: ABOVE
  - 20-day ROC: +1.47%
  - 50-day ROC: +16.64%
  → Economic growth expectations

SP500/Nasdaq:
  - Component score: 0.0/100
  - Current value: 0.2947
  - Position vs EMA50: BELOW
  - 20-day ROC: -1.56%
  - 50-day ROC: -0.34%
  - ⚠️ ANOMALY DETECTED - Significant deviation from the mean

============================================================
CONCLUSIONS AND RECOMMENDATIONS
============================================================

The market shows signs of broad strength. Intermarket ratios suggest
a risk-friendly environment. Elevated risk appetite and positive trends.
Positioning: CONSTRUCTIVE on risk assets.


STRONGEST RATIOS:
  • Oil/Gold: 95.0/100
  • SP500/VIX: 95.0/100
  • Commodities/T30y: 95.0/100

WEAKEST RATIOS:
  • Gold/USD: 75.0/100
  • DJ/Gold: 65.0/100
  • SP500/Nasdaq: 0.0/100

============================================================
Analysis automatically generated by kbmeter.com
Date: 2026-04-15
📄 Detailed Asset Allocation Analysis
ASSET ALLOCATION & REGIME ANALYSIS - 2026-04-15
======================================================================

MARKET REGIME: RISK-ON - UNSTABLE COMMODITIES
REGIME SCORE: 75.0/100

======================================================================
TREND AND VOLATILITY ANALYSIS
======================================================================

GLOBAL EQUITIES (ACWI):
  Short-Term Trend (5d): +2.41% | ABOVE EMA 10
  Medium-Term Trend (20d): +4.39% | ABOVE EMA 50
  Long-Term Trend (60d): +2.14% | ABOVE EMA 200

  5d Volatility: 19.6%
  20d Volatility: 22.7%
  60d Volatility: 17.8%

COMMODITIES (DBC):
  Medium-Term Trend (20d): +0.28% | ABOVE EMA 50
  20d Volatility: 26.5%

ACWI/BND Correlation (30d): 0.675

REGIME INTERPRETATION:
The market is in a risk-on regime. Equities show positive trends across multiple
time horizons and volatility remains contained. Investors favor risk assets.
Suggested positioning: OVERWEIGHT equities.

⚠️ COMMODITIES ALERT: Commodities are showing elevated volatility. This may
indicate uncertainty about economic growth or unstable supply/demand dynamics.

======================================================================
ASSET RANKING - WHO IS OUTPERFORMING?
======================================================================

🥇 1. Global Equities (ACWI) - SCORE: 100/100
     Price: $148.11
     Trend: ABOVE EMA10 | ABOVE EMA50 | ABOVE EMA200
     Performance: 5d +2.41% | 20d +4.39% | 60d +2.14%
     Volatility: 5d 19.6% | 20d 22.7% | 60d 17.8%
     Drawdown: -0.36%
     → Asset in STRONG HEALTH: positive trends and controlled volatility

🥈 2. Global Bonds (BND) - SCORE: 100/100
     Price: $73.98
     Trend: ABOVE EMA10 | ABOVE EMA50 | ABOVE EMA200
     Performance: 5d +0.35% | 20d +0.34% | 60d +0.68%
     Volatility: 5d 2.6% | 20d 5.3% | 60d 4.2%
     Drawdown: -0.95%
     → Asset in STRONG HEALTH: positive trends and controlled volatility

🥉 3. Commodities (DBC) - SCORE: 90/100
     Price: $28.84
     Trend: ABOVE EMA10 | ABOVE EMA50 | ABOVE EMA200
     Performance: 5d +0.98% | 20d +0.28% | 60d +24.53%
     Volatility: 5d 25.8% | 20d 26.5% | 60d 25.8%
     Drawdown: -2.17%
     → Asset in STRONG HEALTH: positive trends and controlled volatility

======================================================================
CORRELATION ANALYSIS - CURRENT vs HISTORICAL
======================================================================

ACWI/BND:
  Current correlation (30d): +0.675
  Historical average (1 year): +0.179
  Deviation: +0.496
  ⚠️ SIGNIFICANT DEVIATION from historical average
  → Positive correlation: diversification IMPAIRED

BND/DBC:
  Current correlation (30d): -0.467
  Historical average (1 year): -0.269
  Deviation: -0.198

ACWI/DBC:
  Current correlation (30d): -0.624
  Historical average (1 year): +0.017
  Deviation: -0.641
  ⚠️ SIGNIFICANT DEVIATION from historical average
  → Negative correlation: possible supply-driven shift

======================================================================
OPERATIONAL SUMMARY
======================================================================

STRONGEST ASSET: Global Equities (Score: 100/100)
WEAKEST ASSET: Commodities (Score: 90/100)

SUGGESTED ACTION: Favor the strongest asset, maintain risk exposure.
DIVERSIFICATION: GOOD - diversification benefits present.

======================================================================
Analysis automatically generated by kbmeter.com
Date: 2026-04-15
The macro week continues to be relatively calm. Today’s focus includes Eurozone industrial production data for February, U.S. import and export price trends, and the April update of the Empire State Index. The first-quarter earnings season for major U.S. banks continues, with Bank of America and Morgan Stanley reporting today. Also noteworthy are results from Hermès (luxury) and ASML (semiconductors).
Already a subscriber? Login here
NOTES AND WARNINGS
Data compiled by kbmeter.com. Analysis date: 15 April 2026 - 7:47 AM GMT+1
This content is provided for informational purposes only and should not be considered financial advice. All scores and assessments are based on the previous trading day’s closing prices. Futures indications refer to the date and time of the analysis.