Markets Hold Cautious Optimism on US-Iran Deal, Earnings in Focus
Financial markets are trying to hold steady and maintain a moderate level of optimism. Hopes for an agreement between the US and Iran do not appear to be fading, and the market is awaiting updates from the Israel/Lebanon summit as well as earnings reports (yesterday Goldman Sachs reported results above expectations and its best quarter in five years).
Sentiment remains neutral with a slight risk-on bias, while volatility stays elevated. Futures indicate an uncertain opening for Europe and a slightly positive start for the United States.
Market Weather Map
April 14, 2026
US Equities
Eu Equities
Asia Equities
Commodities
Bonds
Dollar Index
Technology
Gold
Oil
Crypto
Market Summary
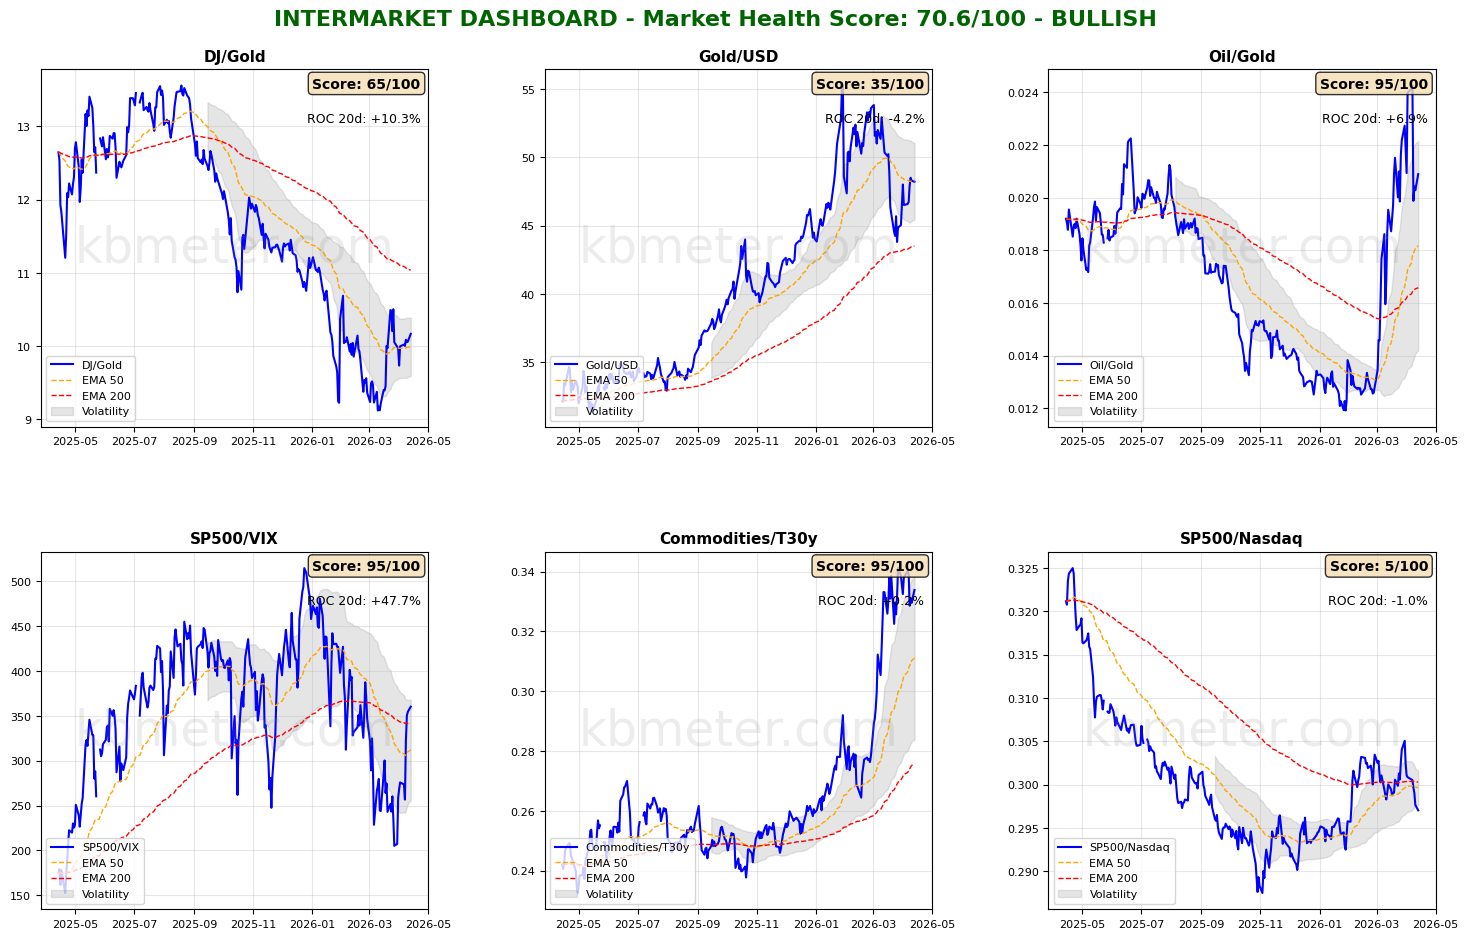
Financial markets today show a neutral to moderately positive sentiment. Intermarket analysis highlights a Market Health Score of 71/100 (positive). Our intermarket dashboards show that the two risk appetite indicators (S&P/VIX and S&P/Nasdaq) have broken above the 200-day moving average, signaling a positive direction. This is a clue—though not definitive proof—of a more confident market environment attempting to form ahead of earnings season, supported by lingering optimism about a potential US–Iran agreement, possibly preceded by one between Israel and Lebanon.
Other indicators remain as a reminder that uncertainty and risks are still elevated. Meanwhile, the Gold/Dollar ratio has reclaimed its 50-day moving average, and the Dow/Gold ratio has climbed back to levels seen at the beginning of the year.
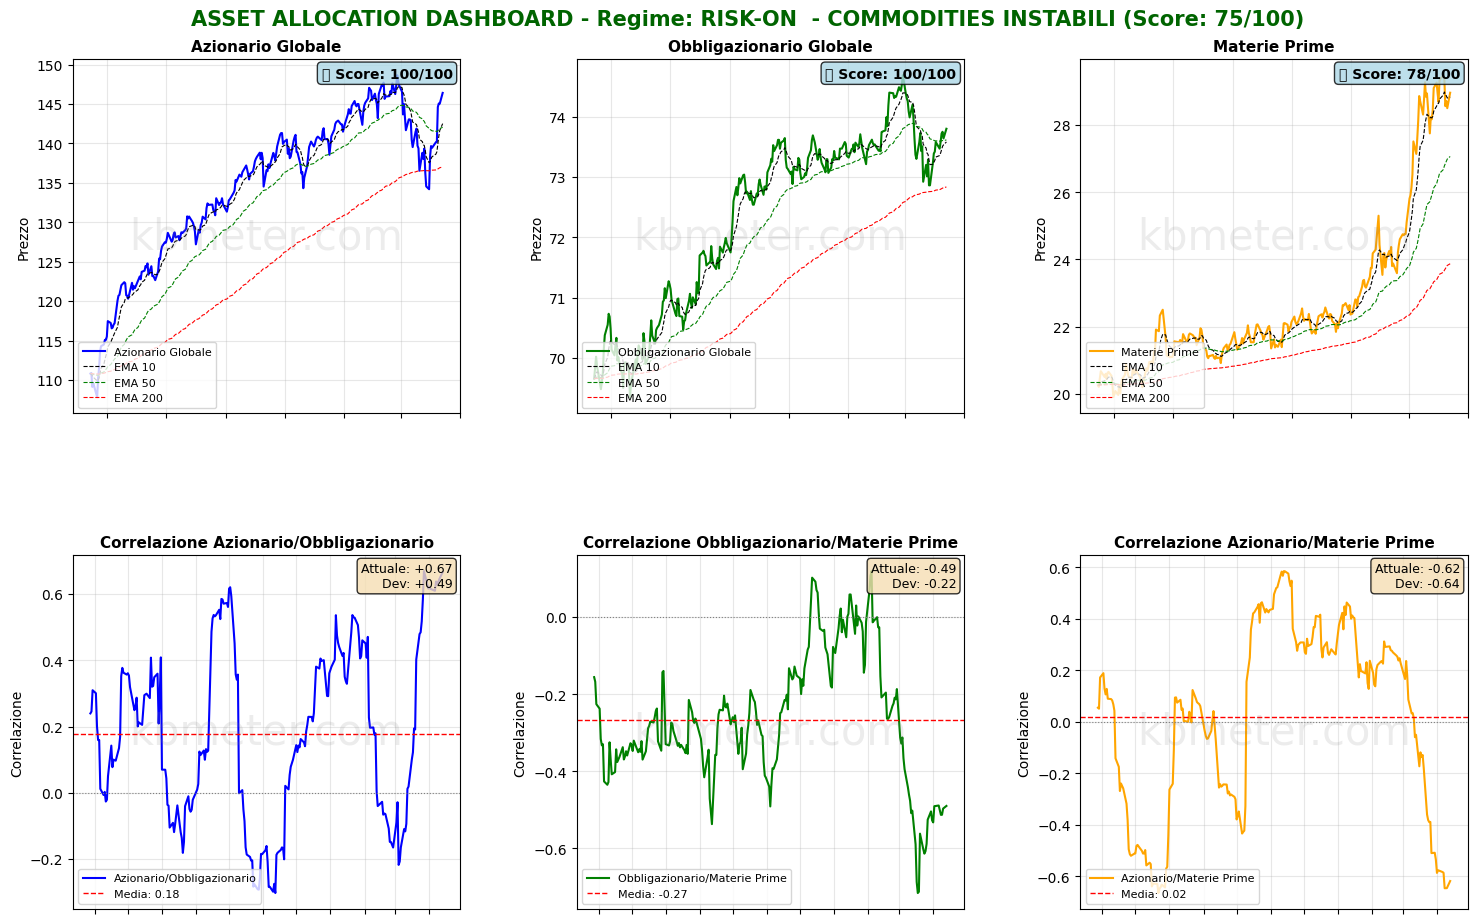
On the asset class front, there is a clear rebound in both equities and bonds, with the bearish crossover between the 50-day and 200-day moving averages not materializing for now. The correlation between the two asset classes remains strong and positive.
Pre-market futures: Global futures point to a moderately risk-off sentiment (average -0.01%), with the US slightly positive (+0.10%), Europe slightly negative (-0.04%), and Asia slightly negative (-0.08%).
📊 Global Futures – Pre-Market Sentiment
- DAX derived: +0.61%
- Mini DAX: +0.58%
- Euro Stoxx 50 derived: +0.43%
- TecDAX derived: -0.84%
- Hang Seng derived: -0.58%
- IBEX 35 derived: -0.58%
📄 Detailed Intermarket Analysis
INTERMARKET ANALYSIS - 2026-04-14
============================================================

MARKET HEALTH SCORE: 70.6/100
SENTIMENT: BULLISH

============================================================
SUMMARY OF KEY RATIOS
============================================================


DJ/Gold:
  - Component score: 65.0/100
  - Current value: 10.1675
  - Position vs EMA50: ABOVE
  - 20-day ROC: +10.34%
  - 50-day ROC: +10.20%
  → Preference for risky assets vs safe haven

Gold/USD:
  - Component score: 35.0/100
  - Current value: 48.2098
  - Position vs EMA50: BELOW
  - 20-day ROC: -4.24%
  - 50-day ROC: -12.72%

Oil/Gold:
  - Component score: 95.0/100
  - Current value: 0.0209
  - Position vs EMA50: ABOVE
  - 20-day ROC: +6.94%
  - 50-day ROC: +69.85%
  → Rising energy demand

SP500/VIX:
  - Component score: 95.0/100
  - Current value: 360.1590
  - Position vs EMA50: ABOVE
  - 20-day ROC: +47.65%
  - 50-day ROC: -12.76%
  → Expanding risk appetite

Commodities/T30y:
  - Component score: 95.0/100
  - Current value: 0.3338
  - Position vs EMA50: ABOVE
  - 20-day ROC: +0.23%
  - 50-day ROC: +14.34%
  → Economic growth expectations

SP500/Nasdaq:
  - Component score: 5.0/100
  - Current value: 0.2970
  - Position vs EMA50: BELOW
  - 20-day ROC: -1.00%
  - 50-day ROC: +0.95%

============================================================
CONCLUSIONS AND RECOMMENDATIONS
============================================================

The market shows broad-based strength signals. Intermarket ratios suggest
a risk-friendly environment. Elevated risk appetite and positive trends.
Positioning: CONSTRUCTIVE on risky assets.


STRONGEST RATIOS:
  • Oil/Gold: 95.0/100
  • SP500/VIX: 95.0/100
  • Commodities/T30y: 95.0/100

WEAKEST RATIOS:
  • DJ/Gold: 65.0/100
  • Gold/USD: 35.0/100
  • SP500/Nasdaq: 5.0/100

============================================================
Analysis automatically generated by kbmeter.com
Date: 2026-04-14
📄 Detailed Asset Allocation Analysis
ASSET ALLOCATION & REGIME ANALYSIS - 2026-04-14
======================================================================

MARKET REGIME: RISK-ON - UNSTABLE COMMODITIES
REGIME SCORE: 75.0/100

======================================================================
TREND AND VOLATILITY ANALYSIS
======================================================================

GLOBAL EQUITIES (ACWI):
  Short-Term Trend (5d): +4.43% | ABOVE EMA 10
  Medium-Term Trend (20d): +3.48% | ABOVE EMA 50
  Long-Term Trend (60d): +0.97% | ABOVE EMA 200

  Volatility 5d: 21.0%
  Volatility 20d: 22.9%
  Volatility 60d: 17.6%

COMMODITIES (DBC):
  Medium-Term Trend (20d): +2.30% | ABOVE EMA 50
  Volatility 20d: 27.0%

ACWI/BND Correlation (30d): 0.666

REGIME INTERPRETATION:
The market is in a risk-on regime. Equities show positive trends across multiple
time horizons and volatility remains contained. Investors favor risky assets.
Suggested positioning: OVERWEIGHT equities.

⚠️ COMMODITIES ALERT: Commodities show elevated volatility. This may
indicate uncertainty about economic growth or unstable supply/demand dynamics.

======================================================================
ASSET RANKING - WHO IS PERFORMING BEST?
======================================================================

🥇 1. Global Equities (ACWI) - SCORE: 100/100
     Price: $146.41
     Trend: ABOVE EMA10 | ABOVE EMA50 | ABOVE EMA200
     Performance: 5d +4.43% | 20d +3.48% | 60d +0.97%
     Volatility: 5d 21.0% | 20d 22.9% | 60d 17.6%
     Drawdown: -1.51%
     → Asset in STRONG HEALTH: positive trends and controlled volatility

🥈 2. Global Bonds (BND) - SCORE: 100/100
     Price: $73.80
     Trend: ABOVE EMA10 | ABOVE EMA50 | ABOVE EMA200
     Performance: 5d +0.30% | 20d +0.30% | 60d +0.27%
     Volatility: 5d 2.4% | 20d 5.4% | 60d 4.1%
     Drawdown: -1.19%
     → Asset in STRONG HEALTH: positive trends and controlled volatility

🥉 3. Commodities (DBC) - SCORE: 78/100
     Price: $28.96
     Trend: ABOVE EMA10 | ABOVE EMA50 | ABOVE EMA200
     Performance: 5d -1.40% | 20d +2.30% | 60d +24.83%
     Volatility: 5d 25.8% | 20d 27.0% | 60d 25.8%
     Drawdown: -1.76%
     → Asset in STRONG HEALTH: positive trends and controlled volatility

======================================================================
CORRELATION ANALYSIS - CURRENT vs HISTORICAL
======================================================================

ACWI/BND:
  Current Correlation (30d): +0.666
  Historical Average (1y): +0.177
  Deviation: +0.488
  ⚠️ SIGNIFICANT DEVIATION from historical average
  → Positive correlation: diversification COMPROMISED

BND/DBC:
  Current Correlation (30d): -0.490
  Historical Average (1y): -0.268
  Deviation: -0.222

ACWI/DBC:
  Current Correlation (30d): -0.618
  Historical Average (1y): +0.020
  Deviation: -0.638
  ⚠️ SIGNIFICANT DEVIATION from historical average
  → Negative correlation: possible supply-driven shift

======================================================================
OPERATIONAL SUMMARY
======================================================================

STRONGEST ASSET: Global Equities (Score: 100/100)
WEAKEST ASSET: Commodities (Score: 78/100)

SUGGESTED ACTION: Favor the strongest asset, maintain risk exposure.
DIVERSIFICATION: GOOD - diversification benefits present.

======================================================================
Analysis automatically generated by kbmeter.com
Date: 2026-04-14
On the macro front, today’s schedule includes Chinese export data, the weekly ADP report update, and US producer price data for March.
As for earnings, today features reports from JP Morgan, Wells Fargo, Citigroup, Johnson & Johnson, Kering, and BlackRock.
Already a subscriber? Login here
NOTES AND WARNINGS
Data compiled by kbmeter.com. Analysis date: 14 April 2026 - 7:37 AM GMT+1
This content is provided for informational purposes only and should not be considered financial advice. All scores and assessments are based on the previous trading day’s closing prices. Futures indications refer to the date and time of the analysis.