Markets Gripped by Uncertainty as Iran Tensions, US PCE Inflation Take Center Stage
Financial markets remain shrouded in uncertainty, dampening any nascent equity rally and fueling volatility. The ceasefire agreement in Iran remains fragile, and the reopening of the Strait of Hormuz is still uncertain. Investor sentiment stays neutral on a day featuring key macroeconomic data from the United States (PCE inflation).
Global equities and bonds are targeting the 50-day moving average to support a potential recovery, while futures point to a positive opening for Europe and a slightly negative one for the United States.
Market Weather Map
April 9, 2026
US Equities
Eu Equities
Asia Equities
Commodities
Bonds
Dollar Index
Technology
Gold
Oil
Crypto
Market Summary
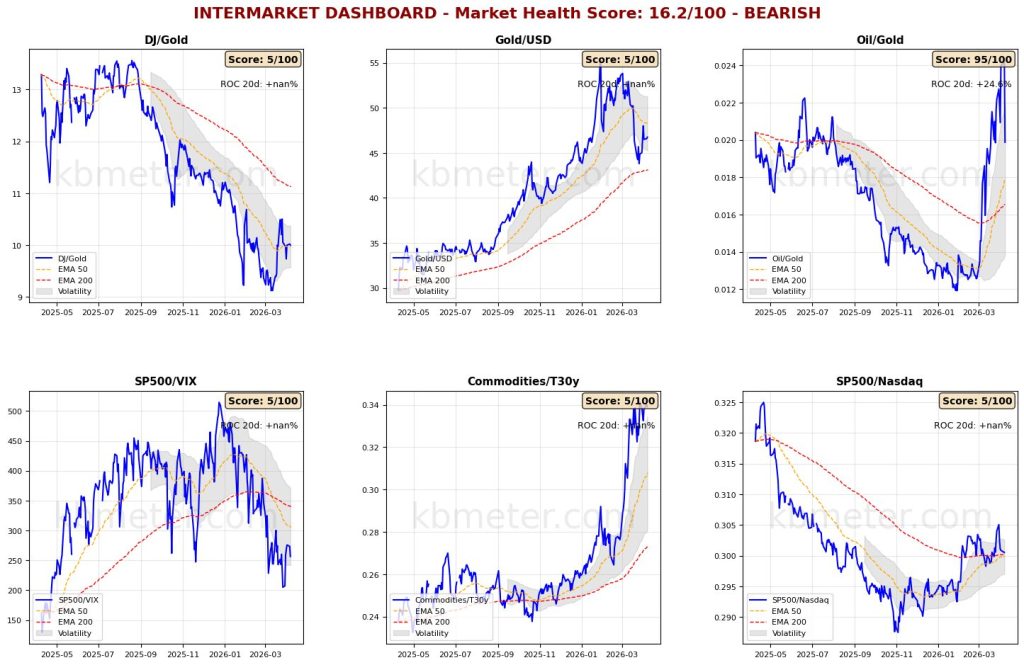
Overall, financial markets are showing a neutral sentiment today. Intermarket analysis highlights a Market Health Score of 16/100 (negative). Our intermarket dashboards indicate that developments in the Middle East have primarily impacted commodities, while risk appetite indicators remain weak. The Oil/Gold ratio has returned to levels seen in September last year, while gold is resuming its recovery against the dollar.
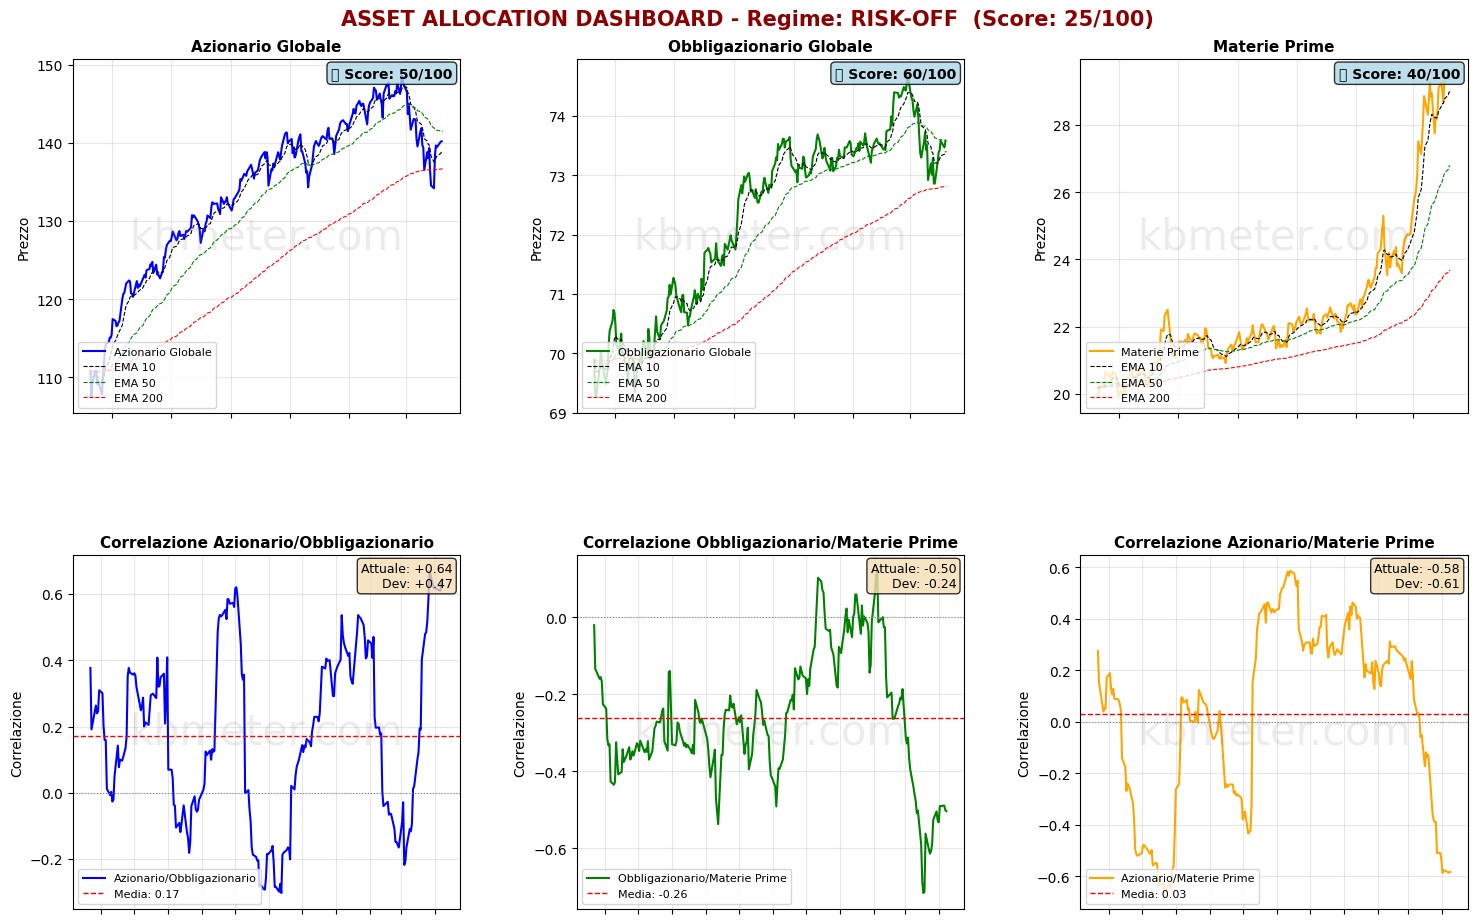
Regarding asset classes, our focus now shifts to the 50-day moving average for both global equities and bonds. A break above this resistance level could provide encouraging signals for a recovery in both asset classes. Until then, the situation remains weak.
Our market weather map does not indicate any assets in clearly positive territory—a cautious, wait-and-see environment that is likely to persist for a few more days.
Pre-Opening Futures: Global futures indicate a risk-on sentiment (average +0.74%), with the U.S. slightly negative (-0.21%), Europe strongly positive (+1.22%), and Asia positive (+0.55%).
📊 Global Futures – Pre-Opening Sentiment
- TecDAX derived: +5.26%
- IBEX 35 derived: +3.99%
- FTSE MIB derived: +3.78%
- Nikkei 225 derived: -1.83%
- Mini DAX: -0.56%
- DAX derived: -0.51%
📄 Detailed Intermarket Analysis
INTERMARKET ANALYSIS - 2026-04-09
============================================================

MARKET HEALTH SCORE: 16.2/100
SENTIMENT: BEARISH

============================================================
MAIN RATIOS SUMMARY
============================================================


DJ/Gold:
  - Component score: 5.0/100
  - Current value: nan
  - Position vs EMA50: BELOW
  - 20-day ROC: +nan%
  - 50-day ROC: +nan%
  → Flight to safe haven

Gold/USD:
  - Component score: 5.0/100
  - Current value: nan
  - Position vs EMA50: BELOW
  - 20-day ROC: +nan%
  - 50-day ROC: +nan%

Oil/Gold:
  - Component score: 95.0/100
  - Current value: 0.0199
  - Position vs EMA50: ABOVE
  - 20-day ROC: +24.57%
  - 50-day ROC: +66.54%
  → Rising energy demand

SP500/VIX:
  - Component score: 5.0/100
  - Current value: nan
  - Position vs EMA50: BELOW
  - 20-day ROC: +nan%
  - 50-day ROC: +nan%

Commodities/T30y:
  - Component score: 5.0/100
  - Current value: nan
  - Position vs EMA50: BELOW
  - 20-day ROC: +nan%
  - 50-day ROC: +nan%
  → Slowdown expectations

SP500/Nasdaq:
  - Component score: 5.0/100
  - Current value: nan
  - Position vs EMA50: BELOW
  - 20-day ROC: +nan%
  - 50-day ROC: +nan%

============================================================
CONCLUSIONS AND RECOMMENDATIONS
============================================================

The market is in bearish territory. Widespread stress signals.
Ongoing risk-off environment. Maximum caution advised.
Positioning: VERY DEFENSIVE, capital preservation.


STRONGEST RATIOS:
  • Oil/Gold: 95.0/100
  • DJ/Gold: 5.0/100
  • Gold/USD: 5.0/100

WEAKEST RATIOS:
  • SP500/VIX: 5.0/100
  • Commodities/T30y: 5.0/100
  • SP500/Nasdaq: 5.0/100

============================================================
Analysis automatically generated by kbmeter.com
Date: 2026-04-09
📄 Detailed Asset Allocation Analysis
ASSET ALLOCATION & REGIME ANALYSIS - 2026-04-09
======================================================================

MARKET REGIME: RISK-OFF
REGIME SCORE: 25.0/100

======================================================================
TREND AND VOLATILITY ANALYSIS
======================================================================

GLOBAL EQUITIES (ACWI):
  Short-Term Trend (5d): +nan% | BELOW EMA 10
  Medium-Term Trend (20d): +nan% | BELOW EMA 50
  Long-Term Trend (60d): +nan% | BELOW EMA 200

  5d Volatility: 7.2%
  20d Volatility: 20.9%
  60d Volatility: 16.3%

COMMODITIES (DBC):
  Medium-Term Trend (20d): +nan% | BELOW EMA 50
  20d Volatility: 26.4%

ACWI/BND Correlation (30d): 0.645

REGIME INTERPRETATION:
The market is in a risk-off regime. Negative trends across multiple horizons and/or elevated volatility.
Flight to safe assets underway.
Suggested positioning: DEFENSIVE, capital protection.

======================================================================
ASSET RANKING - WHICH IS PERFORMING BEST?
======================================================================

🥇 1. Global Bonds (BND) - SCORE: 60/100
     Price: $nan
     Trend: BELOW EMA10 | BELOW EMA50 | BELOW EMA200
     Performance: 5d +nan% | 20d +nan% | 60d +nan%
     Volatility: 5d 2.3% | 20d 5.7% | 60d 4.1%
     Drawdown: nan%
     → Asset in FAIR condition: mostly positive signals

🥈 2. Global Equities (ACWI) - SCORE: 50/100
     Price: $nan
     Trend: BELOW EMA10 | BELOW EMA50 | BELOW EMA200
     Performance: 5d +nan% | 20d +nan% | 60d +nan%
     Volatility: 5d 7.2% | 20d 20.9% | 60d 16.3%
     Drawdown: nan%
     → Asset in NEUTRAL condition: mixed signals

🥉 3. Commodities (DBC) - SCORE: 40/100
     Price: $nan
     Trend: BELOW EMA10 | BELOW EMA50 | BELOW EMA200
     Performance: 5d +nan% | 20d +nan% | 60d +nan%
     Volatility: 5d 19.4% | 20d 26.4% | 60d 24.9%
     Drawdown: nan%
     → Asset in WEAK condition: negative trends or high volatility

======================================================================
CORRELATION ANALYSIS - CURRENT vs HISTORICAL
======================================================================

ACWI/BND:
  Current correlation (30d): +0.645
  Historical average (1 year): +0.172
  Deviation: +0.472
  ⚠️ SIGNIFICANT DEVIATION from historical average
  → Positive correlation: diversification COMPROMISED

BND/DBC:
  Current correlation (30d): -0.503
  Historical average (1 year): -0.263
  Deviation: -0.241

ACWI/DBC:
  Current correlation (30d): -0.582
  Historical average (1 year): +0.031
  Deviation: -0.613
  ⚠️ SIGNIFICANT DEVIATION from historical average
  → Negative correlation: possible supply-driven shift

======================================================================
OPERATIONAL SUMMARY
======================================================================

STRONGEST ASSET: Global Bonds (Score: 60/100)
WEAKEST ASSET: Commodities (Score: 40/100)

SUGGESTED ACTION: Reduce exposure to the weakest asset, favor defensive positioning.
DIVERSIFICATION: GOOD - diversification benefits present.

======================================================================
Analysis automatically generated by kbmeter.com
Date: 2026-04-09
On the macro front, the day features data on German industrial production and exports for February. From the United States, we will also receive figures on February PCE inflation, personal consumption and income, as well as the final reading of economic growth for Q4 2025.
Already a subscriber? Login here
NOTES AND WARNINGS
Data compiled by kbmeter.com. Analysis date: 9 April 2026 - 7:45 AM GMT+1
This content is provided for informational purposes only and should not be considered financial advice. All scores and assessments are based on the previous trading day’s closing prices. Futures indications refer to the date and time of the analysis.