Markets face another low-catalyst day as sentiment remains neutral-to-negative
The week in financial markets began without the “guidance” of Wall Street and could remain subdued today as well, ahead of the release of the Fed minutes (Wednesday) and, most importantly, the U.S. PCE inflation data (Friday). Sentiment remains neutral with a downward bias, while volatility stays elevated. Futures indicate a weak opening for Europe and a negative one for Wall Street.
Market Weather Map
February 17, 2026
US Equities
Eu Equities
Asia Equities
Commodities
Bonds
Dollar Index
Technology
Gold
Oil
Crypto
Market Summary
How to interpret our financial indicators? Find out here.
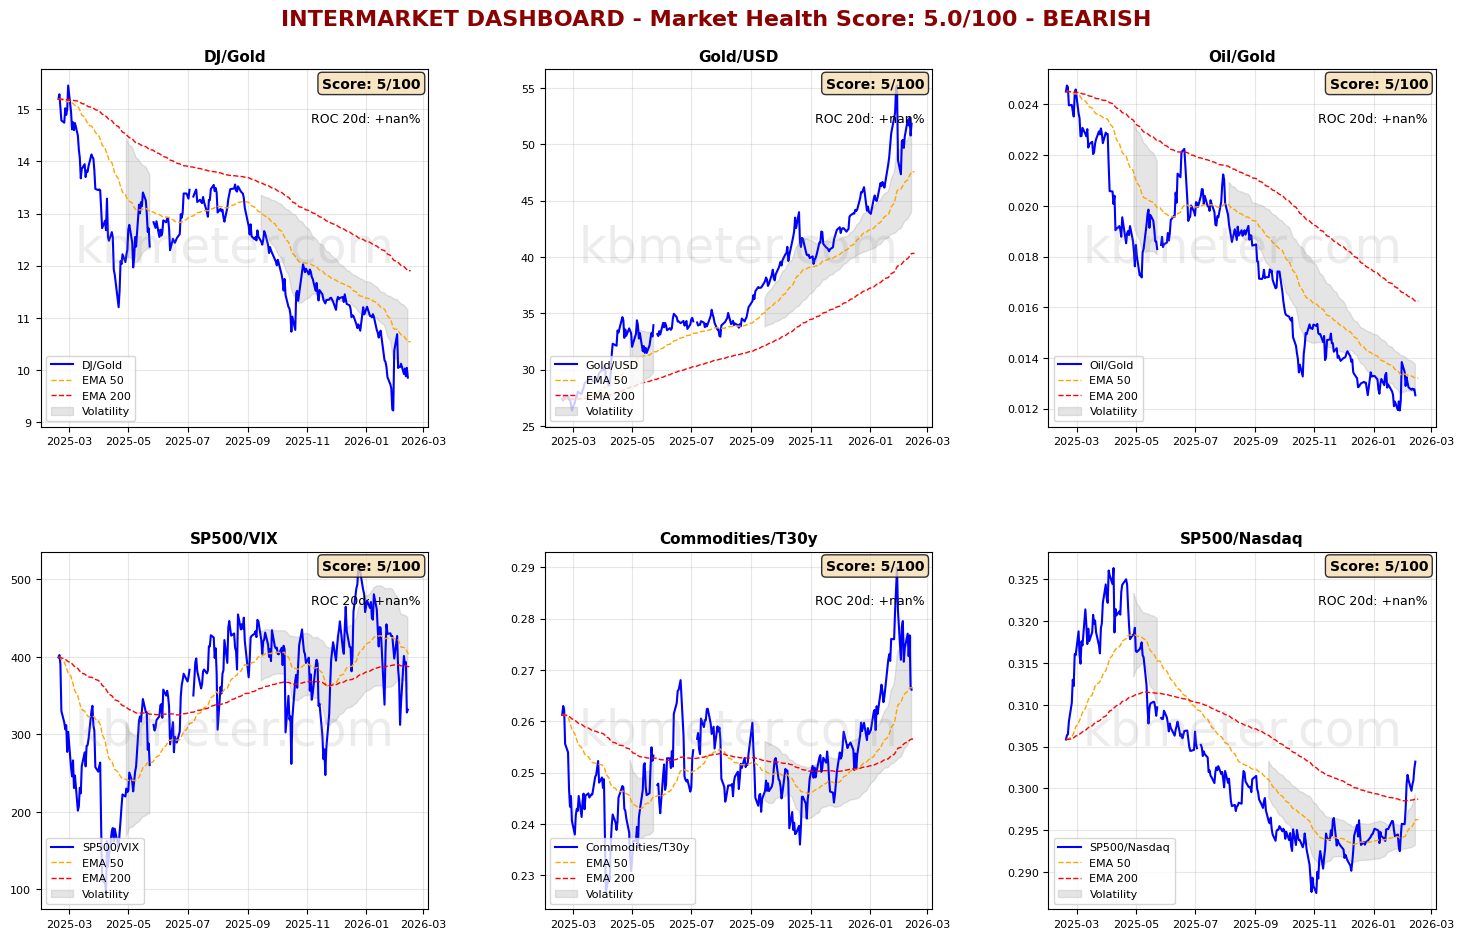
Financial markets today show a neutral to slightly negative sentiment. Intermarket analysis highlights a Market Health Score of 5/100 (negative). Intermarket dashboards, lacking Wall Street data, confirm the indications of recent days, with gold in a stabilization phase. Asset classes continue to move within medium-term uptrends. Also noteworthy today is the strength in the bond market, signaling expectations of lower interest rates and inflation under control.
Pre-Opening Futures: Global futures point to a moderate risk-off sentiment (-0.34% on average), with the U.S. negative (-0.66%), Europe slightly negative (-0.12%), and Asia negative (-0.59%).
📊 Global Futures – Pre-Opening Sentiment
- Hang Seng derived: +0.68%
- TecDAX derived: +0.18%
- CAC 40 derived: +0.11%
- CSI 300: -1.69%
- US Tech 100 derived: -0.88%
- Russell 2000: -0.86%
📄 Detailed Intermarket Analysis
INTERMARKET ANALYSIS - 2026-02-17
============================================================

MARKET HEALTH SCORE: 5.0/100
SENTIMENT: BEARISH

============================================================
SUMMARY OF MAIN RATIOS
============================================================


DJ/Gold:
  - Component score: 5.0/100
  - Current value: nan
  - Position vs EMA50: BELOW
  - 20-day ROC: +nan%
  - 50-day ROC: +nan%
  → Flight to safe haven

Gold/USD:
  - Component score: 5.0/100
  - Current value: nan
  - Position vs EMA50: BELOW
  - 20-day ROC: +nan%
  - 50-day ROC: +nan%

Oil/Gold:
  - Component score: 5.0/100
  - Current value: nan
  - Position vs EMA50: BELOW
  - 20-day ROC: +nan%
  - 50-day ROC: +nan%
  → Declining energy demand

SP500/VIX:
  - Component score: 5.0/100
  - Current value: nan
  - Position vs EMA50: BELOW
  - 20-day ROC: +nan%
  - 50-day ROC: +nan%

Commodities/T30y:
  - Component score: 5.0/100
  - Current value: nan
  - Position vs EMA50: BELOW
  - 20-day ROC: +nan%
  - 50-day ROC: +nan%
  → Expectations of slowdown

SP500/Nasdaq:
  - Component score: 5.0/100
  - Current value: nan
  - Position vs EMA50: BELOW
  - 20-day ROC: +nan%
  - 50-day ROC: +nan%

============================================================
CONCLUSIONS AND RECOMMENDATIONS
============================================================

The market is in bearish territory. Widespread stress signals.
Risk-off movement underway. Maximum caution.
Positioning: VERY DEFENSIVE, capital preservation.


STRONGEST RATIOS:
  • DJ/Gold: 5.0/100
  • Gold/USD: 5.0/100
  • Oil/Gold: 5.0/100

WEAKEST RATIOS:
  • SP500/VIX: 5.0/100
  • Commodities/T30y: 5.0/100
  • SP500/Nasdaq: 5.0/100

============================================================
Analysis automatically generated by kbmeter.com
Date: 2026-02-17
📄 Detailed Asset Allocation Analysis
ASSET ALLOCATION & REGIME ANALYSIS - 2026-02-17
======================================================================
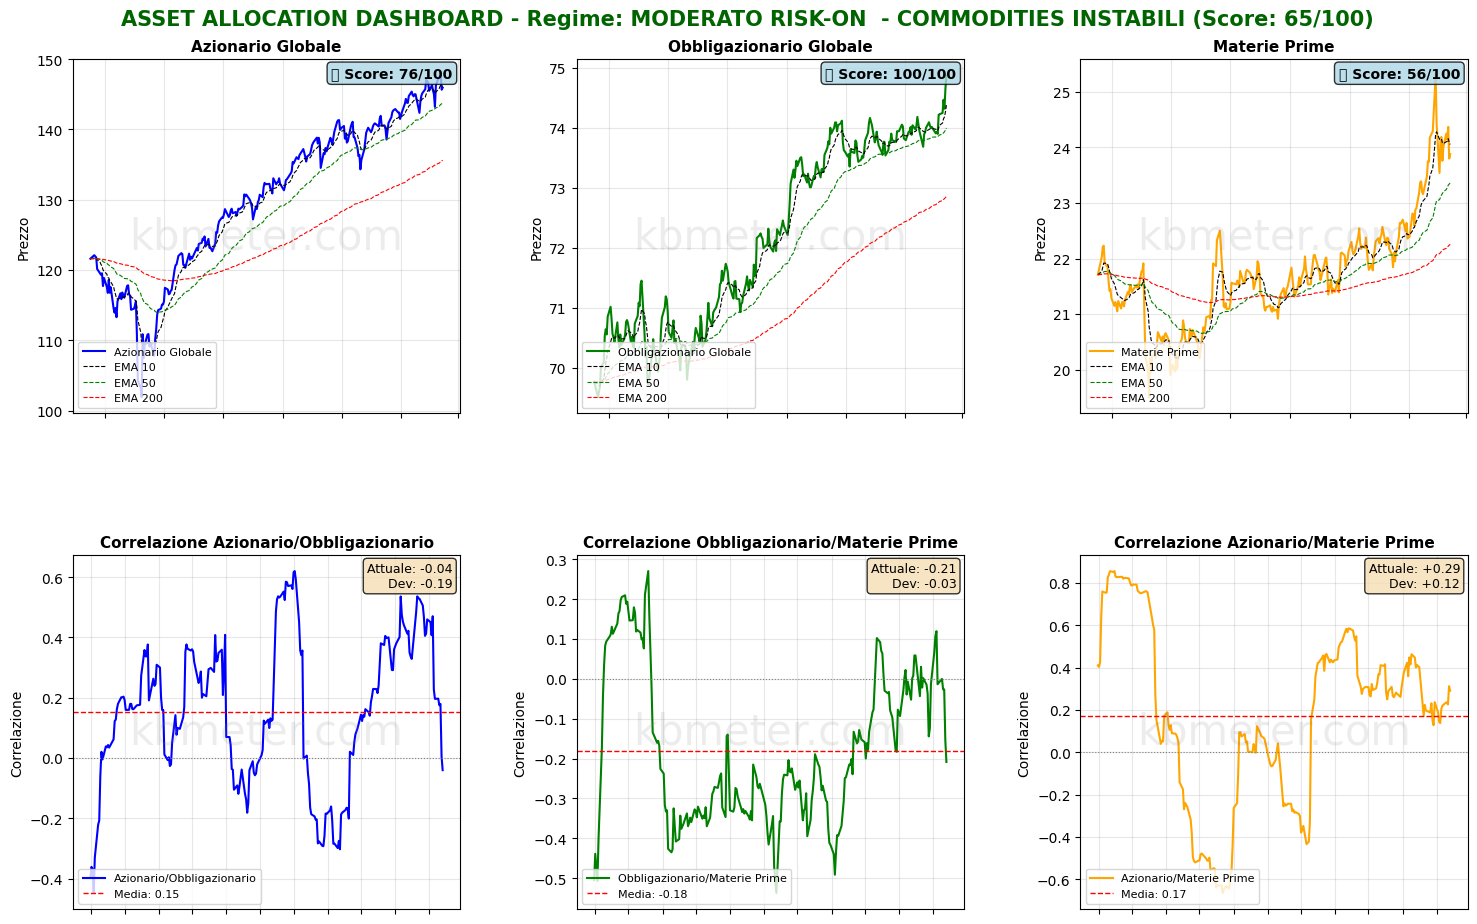
MARKET REGIME: MODERATE RISK-ON - UNSTABLE COMMODITIES
REGIME SCORE: 65.0/100
======================================================================
TREND AND VOLATILITY ANALYSIS
======================================================================
GLOBAL EQUITIES (ACWI):
Short Trend (5d): -1.00% | BELOW EMA 10
Medium Trend (20d): +0.65% | ABOVE EMA 50
Long Trend (60d): +7.16% | ABOVE EMA 200
Volatility 5d: 12.9%
Volatility 20d: 14.7%
Volatility 60d: 11.5%
COMMODITIES (DBC):
Medium Trend (20d): +3.11% | ABOVE EMA 50
Volatility 20d: 27.2%
Correlation ACWI/BND (30d): -0.040
REGIME INTERPRETATION:
The market shows a risk-on bias but with some elements of caution.
The trend is constructive but there may be conflicting signals across some time horizons.
Suggested positioning: BALANCED with a slight tilt toward risk assets.
⚠️ COMMODITIES ALERT: Commodities are showing high volatility. This may
indicate uncertainty about economic growth or unstable supply/demand dynamics.
======================================================================
ASSET RANKING - WHICH IS PERFORMING BEST?
======================================================================
🥇 1. Global Bonds (BND) - SCORE: 100/100
Price: $74.88
Trend: ABOVE EMA10 | ABOVE EMA50 | ABOVE EMA200
Performance: 5d +0.85% | 20d +1.25% | 60d +1.83%
Volatility: 5d 4.1% | 20d 3.3% | 60d 2.9%
Drawdown: 0.00%
→ Asset in STRONG HEALTH: positive trends and controlled volatility
🥈 2. Global Equities (ACWI) - SCORE: 76/100
Price: $145.94
Trend: BELOW EMA10 | ABOVE EMA50 | ABOVE EMA200
Performance: 5d -1.00% | 20d +0.65% | 60d +7.16%
Volatility: 5d 12.9% | 20d 14.7% | 60d 11.5%
Drawdown: -1.20%
→ Asset in STRONG HEALTH: positive trends and controlled volatility
🥉 3. Commodities (DBC) - SCORE: 56/100
Price: $23.88
Trend: BELOW EMA10 | ABOVE EMA50 | ABOVE EMA200
Performance: 5d -1.53% | 20d +3.11% | 60d +6.72%
Volatility: 5d 21.9% | 20d 27.2% | 60d 18.9%
Drawdown: -5.61%
→ Asset in FAIR condition: mostly positive signals
======================================================================
CORRELATION ANALYSIS - CURRENT vs HISTORICAL
======================================================================
ACWI/BND:
Current correlation (30d): -0.040
Historical average (1 year): +0.154
Deviation: -0.194
→ Weak correlation: moderate diversification
BND/DBC:
Current correlation (30d): -0.208
Historical average (1 year): -0.181
Deviation: -0.027
ACWI/DBC:
Current correlation (30d): +0.291
Historical average (1 year): +0.172
Deviation: +0.119
======================================================================
OPERATIONAL SUMMARY
======================================================================
STRONGEST ASSET: Global Bonds (Score: 100/100)
WEAKEST ASSET: Commodities (Score: 56/100)
SUGGESTED ACTION: Favor the strongest asset, maintain risk exposure.
DIVERSIFICATION: EXCELLENT - Asset classes are moving independently.
======================================================================
Analysis automatically generated by kbmeter.com
Date: 2026-02-17
On the macroeconomic front, today’s releases include UK employment data for late 2025, the German ZEW investor confidence index for February, Canadian inflation for January, and updates to the NY Empire Index and ADP’s weekly labor market report.
Already a subscriber? Login here
NOTES AND WARNINGS
Analysis automatically generated by kbmeter.com. Analysis date: 17 February 2026 - 11:15 AM GMT+1
This content is provided for informational purposes only and should not be considered financial advice. All scores and assessments are based on the previous trading day’s closing prices. Futures indications refer to the date and time of the analysis.