Markets Eye Middle East for Breakthrough as Volatility Stays Elevated
Financial markets are awaiting positive developments on the Middle Eastern front. A channel for dialogue appears to be open, and hopes for a ceasefire are fostering a climate of cautious confidence among investors. Sentiment remains between neutral and moderately negative, volatility is still elevated, but risk indicators seem to be stabilizing after turbulent sessions. Futures point to a positive opening for the United States and a moderately positive one for Europe.
Market Weather Map
March 25, 2026
US Equities
Eu Equities
Asia Equities
Commodities
Bonds
Dollar Index
Technology
Gold
Oil
Crypto
Market Summary
Financial markets today show a neutral to moderately negative sentiment. Intermarket analysis highlights a Market Health Score of 5/100 (negative). Our intermarket dashboards indicate a situation broadly stable compared to yesterday, with the main risk appetite indicators still in a delicate zone and a substantial freeze in the balance between gold and oil. We will see whether the coming hours can “unfreeze” the situation.
On the asset class front, the long-term moving average continues to provide “protection” to global equities and bonds, while commodities remain below the short-term moving average.
Our weather map shows that only one asset (oil) exceeds the 50-point threshold, and only bonds display a downward trend in the directionality analysis. This is not a positive situation, but in many respects one of waiting.
Pre-Opening Futures: Global futures indicate a risk-on sentiment (average +0.58%), with the US positive (+0.93%), Europe slightly positive (+0.27%), and Asia strongly positive (+1.05%).
📊 Global Futures – Pre-Opening Sentiment
- Russell 2000: +1.26%
- DAX derived: +1.22%
- Hang Seng derived: +1.15%
- TecDAX derived: -0.97%
- IBEX 35 derived: -0.65%
- Mini MDAX derived: +0.00%
📄 Detailed Intermarket Analysis
INTERMARKET ANALYSIS - 2026-03-25
============================================================

MARKET HEALTH SCORE: 5.0/100
SENTIMENT: BEARISH

============================================================
SUMMARY OF MAIN RELATIONSHIPS
============================================================


DJ/Gold:
  - Component score: 5.0/100
  - Current value: nan
  - Position vs EMA50: BELOW
  - 20-day ROC: +nan%
  - 50-day ROC: +nan%
  → Flight to safe haven

Gold/USD:
  - Component score: 5.0/100
  - Current value: nan
  - Position vs EMA50: BELOW
  - 20-day ROC: +nan%
  - 50-day ROC: +nan%

Oil/Gold:
  - Component score: 5.0/100
  - Current value: nan
  - Position vs EMA50: BELOW
  - 20-day ROC: +nan%
  - 50-day ROC: +nan%
  → Declining energy demand

SP500/VIX:
  - Component score: 5.0/100
  - Current value: nan
  - Position vs EMA50: BELOW
  - 20-day ROC: +nan%
  - 50-day ROC: +nan%

Commodities/T30y:
  - Component score: 5.0/100
  - Current value: nan
  - Position vs EMA50: BELOW
  - 20-day ROC: +nan%
  - 50-day ROC: +nan%
  → Expectations of slowdown

SP500/Nasdaq:
  - Component score: 5.0/100
  - Current value: nan
  - Position vs EMA50: BELOW
  - 20-day ROC: +nan%
  - 50-day ROC: +nan%

============================================================
CONCLUSIONS AND RECOMMENDATIONS
============================================================

The market is in bearish territory. Signs of widespread stress.
Ongoing flight from risk. Maximum caution.
Positioning: VERY DEFENSIVE, capital preservation.


STRONGEST RELATIONSHIPS:
  • DJ/Gold: 5.0/100
  • Gold/USD: 5.0/100
  • Oil/Gold: 5.0/100

WEAKEST RELATIONSHIPS:
  • SP500/VIX: 5.0/100
  • Commodities/T30y: 5.0/100
  • SP500/Nasdaq: 5.0/100

============================================================
Analysis automatically generated by kbmeter.com
Date: 2026-03-25
📄 Detailed Asset Allocation Analysis
ASSET ALLOCATION & REGIME ANALYSIS - 2026-03-25
======================================================================
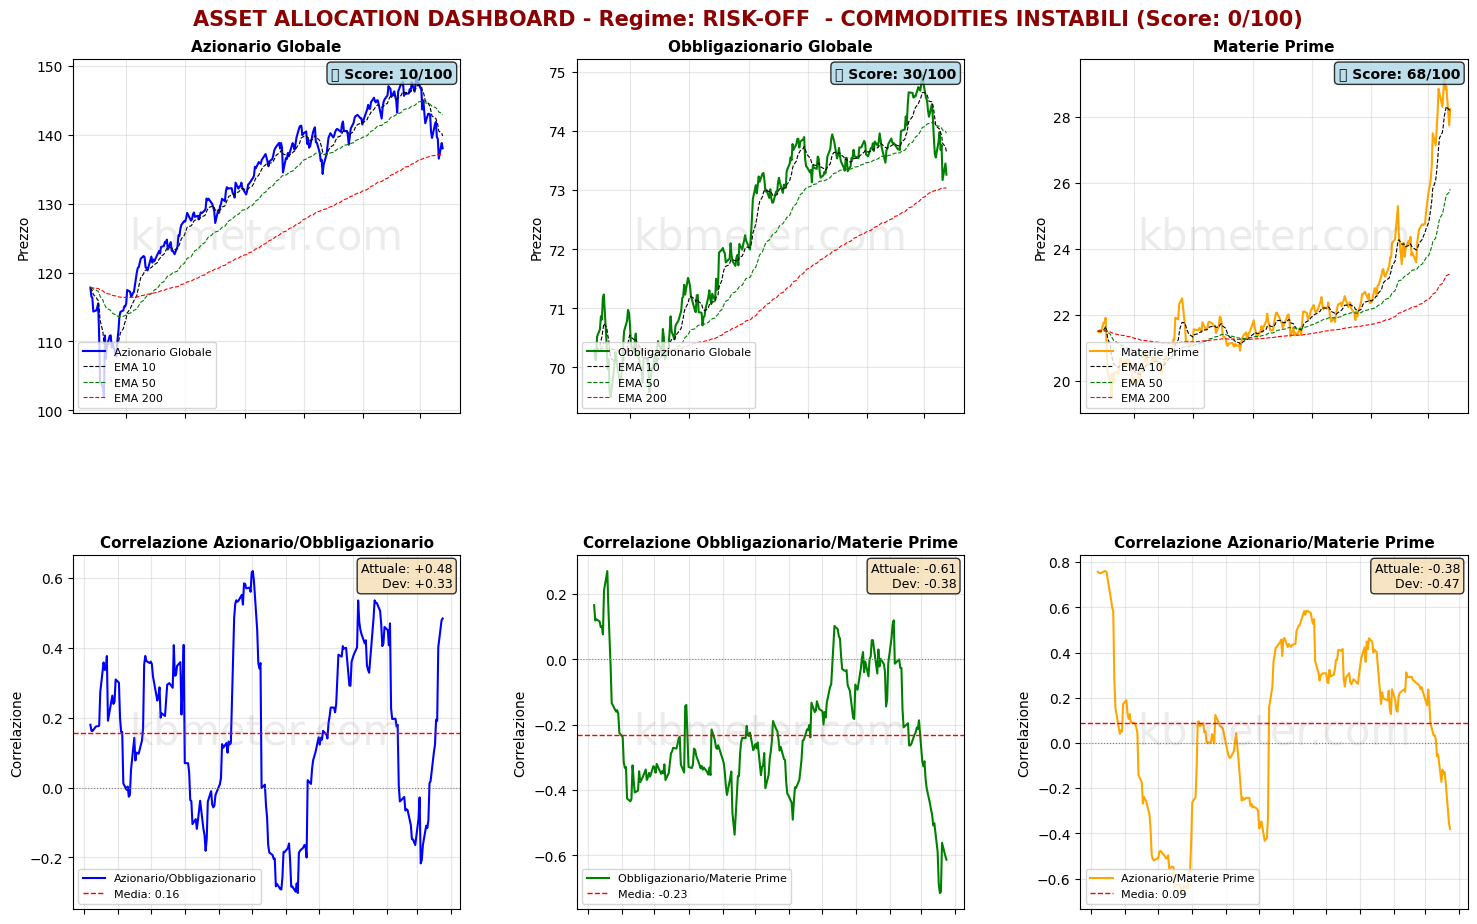
MARKET REGIME: RISK-OFF - UNSTABLE COMMODITIES
REGIME SCORE: 0.0/100
======================================================================
TREND AND VOLATILITY ANALYSIS
======================================================================
GLOBAL EQUITIES (ACWI):
Short-Term Trend (5d): -1.20% | BELOW EMA 10
Medium-Term Trend (20d): -7.14% | BELOW EMA 50
Long-Term Trend (60d): -3.40% | ABOVE EMA 200
Volatility 5d: 22.7%
Volatility 20d: 17.4%
Volatility 60d: 14.1%
COMMODITIES (DBC):
Medium-Term Trend (20d): +14.10% | ABOVE EMA 50
Volatility 20d: 28.9%
ACWI/BND Correlation (30d): 0.484
REGIME INTERPRETATION:
The market is in a risk-off regime. Negative trends across multiple timeframes and/or
elevated volatility. Flight to safe assets.
Suggested positioning: DEFENSIVE, capital protection.
⚠️ COMMODITIES ALERT: Commodities show elevated volatility. This may
indicate uncertainty about economic growth or unstable supply/demand dynamics.
======================================================================
ASSET RANKING - WHICH IS PERFORMING BEST?
======================================================================
🥇 1. Commodities (DBC) - SCORE: 68/100
Price: $28.24
Trend: ABOVE EMA10 | ABOVE EMA50 | ABOVE EMA200
Performance: 5d -3.52% | 20d +14.10% | 60d +24.41%
Volatility: 5d 39.6% | 20d 28.9% | 60d 24.6%
Drawdown: -3.52%
→ Asset in FAIR condition: mostly positive signals
🥈 2. Global Bonds (BND) - SCORE: 30/100
Price: $73.26
Trend: BELOW EMA10 | BELOW EMA50 | ABOVE EMA200
Performance: 5d -0.57% | 20d -1.91% | 60d -0.63%
Volatility: 5d 7.3% | 20d 5.0% | 60d 3.8%
Drawdown: -2.24%
→ Asset in WEAK condition: negative trends or elevated volatility
🥉 3. Global Equities (ACWI) - SCORE: 10/100
Price: $138.04
Trend: BELOW EMA10 | BELOW EMA50 | ABOVE EMA200
Performance: 5d -1.20% | 20d -7.14% | 60d -3.40%
Volatility: 5d 22.7% | 20d 17.4% | 60d 14.1%
Drawdown: -7.14%
→ Asset UNDER PRESSURE: avoid or significantly underweight
======================================================================
CORRELATION ANALYSIS - CURRENT vs HISTORICAL
======================================================================
ACWI/BND:
Current correlation (30d): +0.484
Historical average (1 year): +0.155
Deviation: +0.329
⚠️ SIGNIFICANT DEVIATION from historical average
→ Positive correlation: diversification COMPROMISED
BND/DBC:
Current correlation (30d): -0.614
Historical average (1 year): -0.231
Deviation: -0.383
⚠️ SIGNIFICANT DEVIATION from historical average
ACWI/DBC:
Current correlation (30d): -0.381
Historical average (1 year): +0.090
Deviation: -0.471
⚠️ SIGNIFICANT DEVIATION from historical average
→ Negative correlation: possible supply-driven shift
======================================================================
OPERATIONAL SUMMARY
======================================================================
STRONGEST ASSET: Commodities (Score: 68/100)
WEAKEST ASSET: Global Equities (Score: 10/100)
SUGGESTED ACTION: Reduce exposure to the weakest asset, favor defensive positions.
DIVERSIFICATION: GOOD - diversification benefits present.
======================================================================
Analysis automatically generated by kbmeter.com
Date: 2026-03-25
On the macro front, today’s agenda includes February inflation data from the UK and Australia, German business confidence for March (another clue on the early effects of the Middle East crisis following yesterday’s PMIs), US international trade figures for February, and the weekly update on 30-year mortgage rates in the United States.
Already a subscriber? Login here
NOTES AND WARNINGS
Data compiled by kbmeter.com. Analysis date: 25 March 2026 - 7:20 AM GMT+1
This content is provided for informational purposes only and should not be considered financial advice. All scores and assessments are based on the previous trading day’s closing prices. Futures indications refer to the date and time of the analysis.