Markets Extend Weekly Gains as Risk-On Sentiment Strengthens
Financial markets are continuing the week with renewed confidence, as a stronger risk-on sentiment takes hold. Positive news from the Middle East and solid corporate earnings are guiding investors through a week with limited but still meaningful macroeconomic catalysts (today’s releases include China’s GDP and the final March inflation reading for the Eurozone).
Equities are rebounding, gold is stabilizing, and the US dollar remains weak—these appear to be the defining features of the current environment, although volatility is still elevated. Futures point to a positive opening for both Europe and the United States.
Market Weather Map
April 16, 2026
US Equities
Eu Equities
Asia Equities
Commodities
Bonds
Dollar Index
Technology
Gold
Oil
Crypto
Market Summary
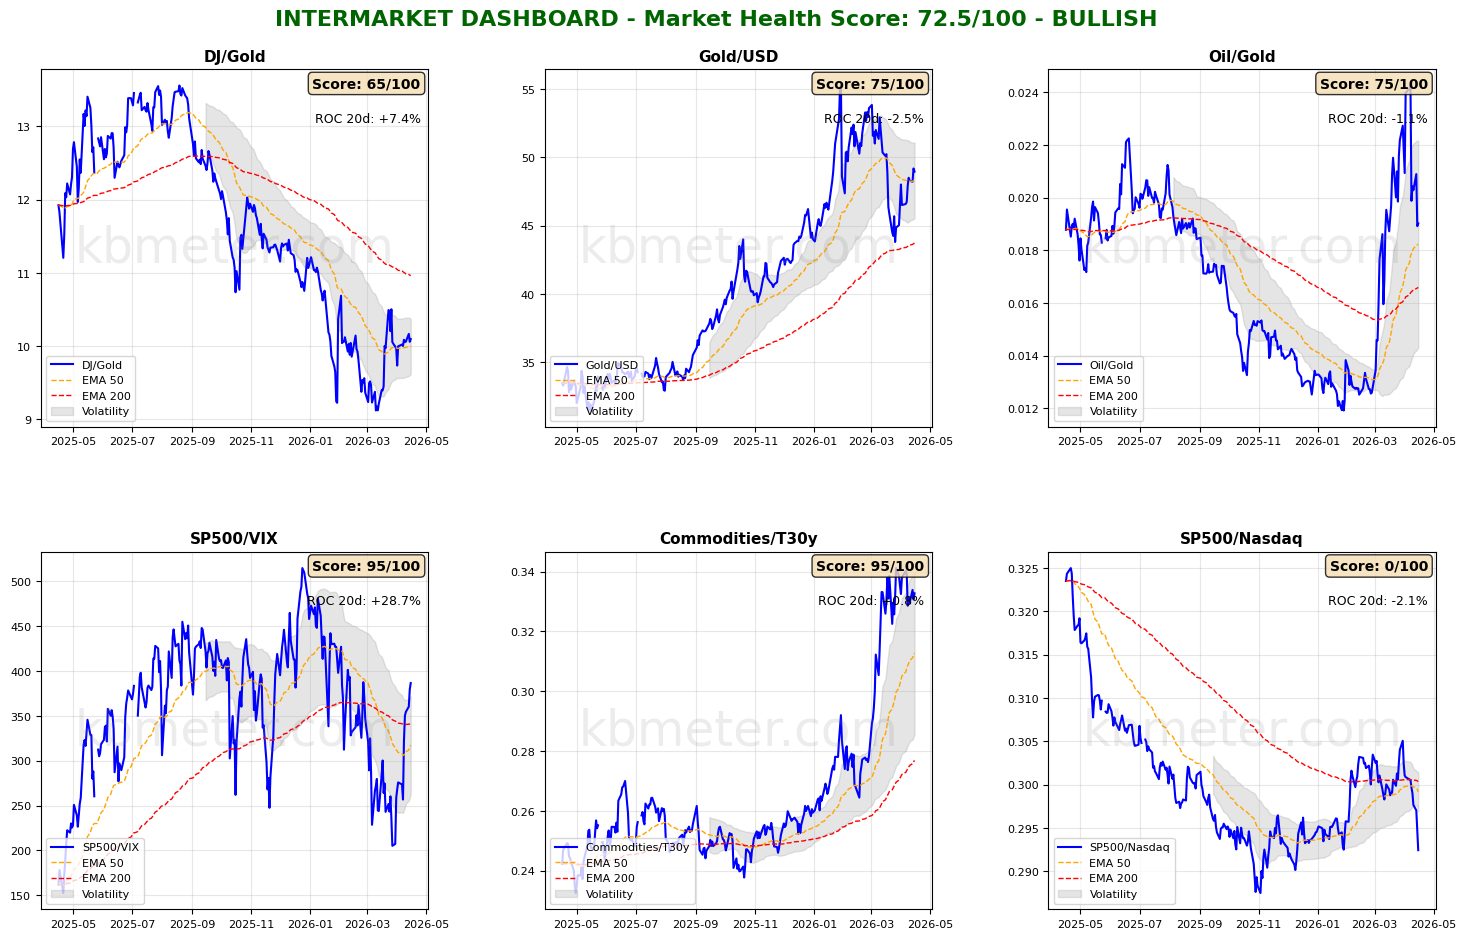
Financial markets are showing a moderately positive sentiment today. Intermarket analysis highlights a Market Health Score of 72/100 (positive). Our intermarket dashboards confirm an improvement in market sentiment, with risk appetite indicators largely recovering the declines seen in March. Notably, the Nasdaq has strengthened significantly relative to the S&P 500 in the lead-up to earnings season, while gold’s recovery is stabilizing.
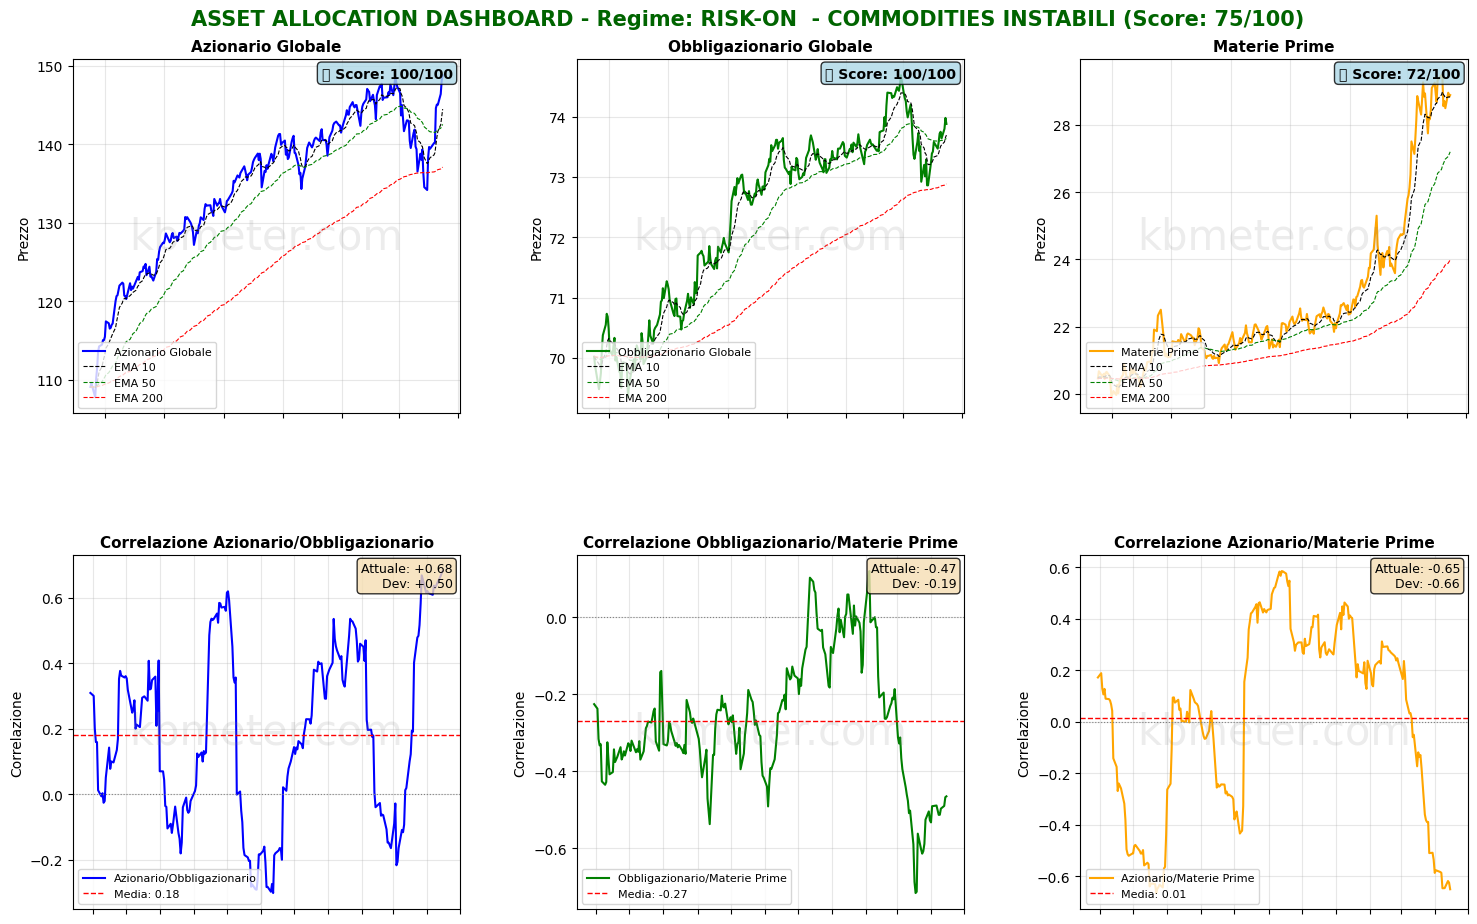
There are few major updates on the asset class front. However, it is worth emphasizing the strength of the rebound across both global equities and global bonds, with prices in the two asset classes continuing to show a meaningful positive correlation.
Pre-Market Futures: Global futures indicate a moderate risk-on sentiment (average +0.27%), with the US slightly positive (+0.12%), Europe slightly positive (+0.17%), and Asia more firmly positive (+0.76%).
📊 Global Futures – Pre-Market Sentiment
- Nikkei 225 derived: +1.64%
- TecDAX derived: +1.35%
- Hang Seng derived: +0.59%
- IBEX 35 derived: -0.68%
- FTSE MIB derived: -0.07%
- Mini MDAX derived: +0.00%
📄 Detailed Intermarket Analysis
INTERMARKET ANALYSIS - 2026-04-16
============================================================

MARKET HEALTH SCORE: 72.5/100
SENTIMENT: BULLISH

============================================================
SUMMARY OF MAIN RATIOS
============================================================


DJ/Gold:
  - Component score: 65.0/100
  - Current value: 10.0966
  - Position vs EMA50: ABOVE
  - 20-day ROC: +7.45%
  - 50-day ROC: -5.54%
  → Preference for risk assets vs safe haven

Gold/USD:
  - Component score: 75.0/100
  - Current value: 48.9496
  - Position vs EMA50: ABOVE
  - 20-day ROC: -2.53%
  - 50-day ROC: +3.36%

Oil/Gold:
  - Component score: 75.0/100
  - Current value: 0.0190
  - Position vs EMA50: ABOVE
  - 20-day ROC: -1.14%
  - 50-day ROC: +41.48%
  → Declining energy demand

SP500/VIX:
  - Component score: 95.0/100
  - Current value: 386.5135
  - Position vs EMA50: ABOVE
  - 20-day ROC: +28.74%
  - 50-day ROC: -9.47%
  → Expanding risk appetite

Commodities/T30y:
  - Component score: 95.0/100
  - Current value: 0.3327
  - Position vs EMA50: ABOVE
  - 20-day ROC: +0.77%
  - 50-day ROC: +21.44%
  → Economic growth expectations

SP500/Nasdaq:
  - Component score: 0.0/100
  - Current value: 0.2924
  - Position vs EMA50: BELOW
  - 20-day ROC: -2.12%
  - 50-day ROC: -1.11%
  - ⚠️ ANOMALY DETECTED - Significant deviation from the mean

============================================================
CONCLUSIONS AND RECOMMENDATIONS
============================================================

The market shows broad-based strength. Intermarket ratios suggest
a risk-friendly environment. High risk appetite and positive trends.
Positioning: CONSTRUCTIVE on risk assets.


STRONGEST RATIOS:
  • SP500/VIX: 95.0/100
  • Commodities/T30y: 95.0/100
  • Gold/USD: 75.0/100

WEAKEST RATIOS:
  • Oil/Gold: 75.0/100
  • DJ/Gold: 65.0/100
  • SP500/Nasdaq: 0.0/100

============================================================
Analysis automatically generated by kbmeter.com
Date: 2026-04-16
📄 Detailed Asset Allocation Analysis
ASSET ALLOCATION & REGIME ANALYSIS - 2026-04-16
======================================================================

MARKET REGIME: RISK-ON - UNSTABLE COMMODITIES
REGIME SCORE: 75.0/100

======================================================================
TREND AND VOLATILITY ANALYSIS
======================================================================

GLOBAL EQUITIES (ACWI):
  Short-Term Trend (5d): +2.57% | ABOVE EMA 10
  Medium-Term Trend (20d): +6.51% | ABOVE EMA 50
  Long-Term Trend (60d): +4.52% | ABOVE EMA 200

  5d Volatility: 7.6%
  20d Volatility: 22.8%
  60d Volatility: 17.8%

COMMODITIES (DBC):
  Medium-Term Trend (20d): -1.30% | ABOVE EMA 50
  20d Volatility: 26.0%

ACWI/BND Correlation (30d): 0.682

REGIME INTERPRETATION:
The market is in a risk-on regime. Equities show positive trends across multiple
time horizons and volatility remains contained. Investors favor risk assets.
Suggested positioning: OVERWEIGHT equities.

⚠️ COMMODITIES ALERT: Commodities show elevated volatility. This may
indicate uncertainty around economic growth or unstable supply/demand dynamics.

======================================================================
ASSET RANKING - WHO IS PERFORMING BEST?
======================================================================

🥇 1. Global Equities (ACWI) - SCORE: 100/100
     Price: $148.80
     Trend: ABOVE EMA10 | ABOVE EMA50 | ABOVE EMA200
     Performance: 5d +2.57% | 20d +6.51% | 60d +4.52%
     Volatility: 5d 7.6% | 20d 22.8% | 60d 17.8%
     Drawdown: 0.00%
     → Asset in STRONG HEALTH: positive trends and controlled volatility

🥈 2. Global Bonds (BND) - SCORE: 100/100
     Price: $73.88
     Trend: ABOVE EMA10 | ABOVE EMA50 | ABOVE EMA200
     Performance: 5d +0.18% | 20d +0.61% | 60d +0.91%
     Volatility: 5d 3.0% | 20d 5.3% | 60d 4.2%
     Drawdown: -1.08%
     → Asset in STRONG HEALTH: positive trends and controlled volatility

🥉 3. Commodities (DBC) - SCORE: 72/100
     Price: $28.89
     Trend: ABOVE EMA10 | ABOVE EMA50 | ABOVE EMA200
     Performance: 5d +0.63% | 20d -1.30% | 60d +23.04%
     Volatility: 5d 14.5% | 20d 26.0% | 60d 25.7%
     Drawdown: -2.00%
     → Asset in STRONG HEALTH: positive trends and controlled volatility

======================================================================
CORRELATION ANALYSIS - CURRENT vs HISTORICAL
======================================================================

ACWI/BND:
  Current correlation (30d): +0.682
  Historical average (1 year): +0.181
  Deviation: +0.501
  ⚠️ SIGNIFICANT DEVIATION from historical average
  → Positive correlation: diversification COMPROMISED

BND/DBC:
  Current correlation (30d): -0.465
  Historical average (1 year): -0.271
  Deviation: -0.194

ACWI/DBC:
  Current correlation (30d): -0.650
  Historical average (1 year): +0.014
  Deviation: -0.663
  ⚠️ SIGNIFICANT DEVIATION from historical average
  → Negative correlation: possible supply-driven shift

======================================================================
OPERATIONAL SUMMARY
======================================================================

STRONGEST ASSET: Global Equities (Score: 100/100)
WEAKEST ASSET: Commodities (Score: 72/100)

SUGGESTED ACTION: Favor the strongest asset, maintain exposure to risk.
DIVERSIFICATION: GOOD - diversification benefits present.

======================================================================
Analysis automatically generated by kbmeter.com
Date: 2026-04-16
On the macro front, today’s calendar includes data on economic activity in China and the UK, employment figures from Australia, the final March inflation reading for the Eurozone, the April 2026 Philly Fed index, updates on US jobless claims, and US industrial production for March.
As for earnings, today brings results from another semiconductor giant, TSM, as well as reports from Netflix, Charles Schwab, and PepsiCo.
Already a subscriber? Login here
NOTES AND WARNINGS
Data compiled by kbmeter.com. Analysis date: 16 April 2026 - 7:55 AM GMT+1
This content is provided for informational purposes only and should not be considered financial advice. All scores and assessments are based on the previous trading day’s closing prices. Futures indications refer to the date and time of the analysis.