Markets End Week in Limbo as Geopolitics and AI Take Center Stage
The week in financial markets ends in a kind of limbo. As mentioned yesterday, news coming from the Middle East and corporate earnings is mixed, making it difficult for investors to decide which direction to take. Oil has risen for the fifth consecutive day, while the technology sector is reacting positively to Intel’s forecasts but is also weighing new announcements of job cuts linked to the costs of AI investments.
While waiting for greater clarity, sentiment remains moderately positive and volatility is still elevated. Futures indicate a flat opening for the United States and a slightly negative one for Europe.
Market Weather Map
April 24, 2026
US Equities
Eu Equities
Asia Equities
Commodities
Bonds
Dollar Index
Technology
Gold
Oil
Crypto
Market Summary
Financial markets sentiment
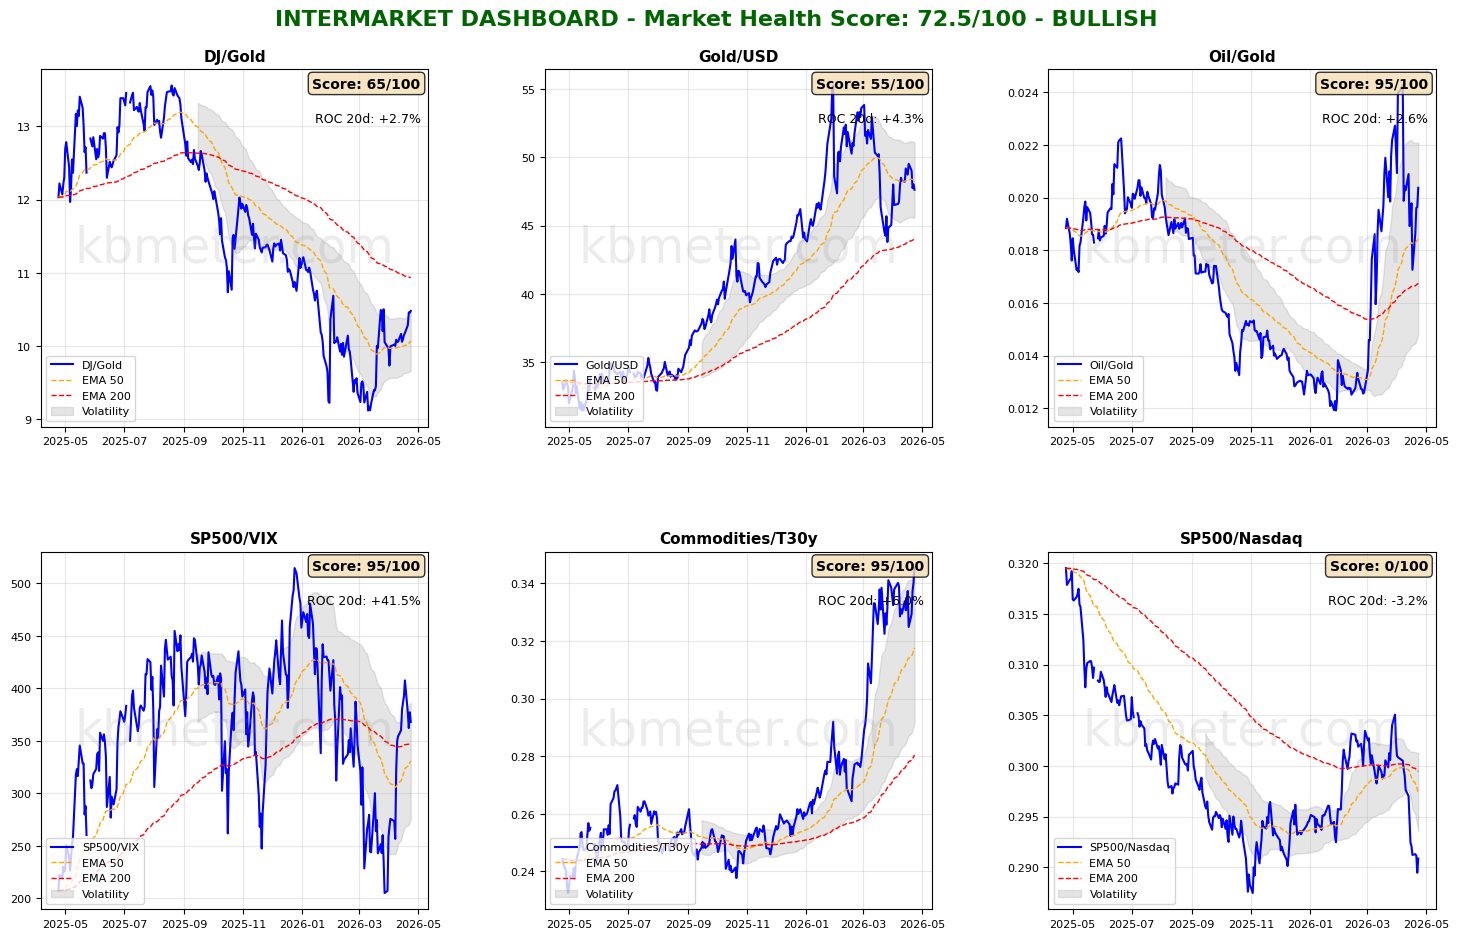
Financial markets today show a moderately positive sentiment. Intermarket analysis highlights a Market Health Score of 72/100 (positive). There are few updates regarding our intermarket dashboards: the situation remains largely in a wait-and-see mode, with risk appetite indicators still tilted toward a risk-on stance, but without further improvement.
Notably, the Commodities/T30 ratio has returned to its highs, signaling persistently elevated inflation expectations, while uncertainty in the Middle East is driving both oil and the dollar higher.
Across asset classes, the situation currently appears frozen, and yesterday’s analysis still holds.
Global Futures – Pre-Market Sentiment
Pre-Market Futures: Global futures signal a moderate risk-off sentiment (average -0.10%), with the US slightly negative (-0.03%), Europe slightly negative (-0.32%), and Asia slightly positive (+0.48%).
📊 Global Futures – Pre-Market Sentiment
- Nikkei 225 derived: +1.31%
- US Tech 100 derived: +0.47%
- Hang Seng derived: +0.40%
- IBEX 35 derived: -1.73%
- Euro Stoxx 50 derived: -0.67%
- Russell 2000: -0.39%
Intermarket details
📄 Detailed Intermarket Analysis
INTERMARKET ANALYSIS - 2026-04-24
============================================================

MARKET HEALTH SCORE: 72.5/100
SENTIMENT: BULLISH

============================================================
MAIN RATIOS SUMMARY
============================================================


DJ/Gold:
  - Component score: 65.0/100
  - Current value: 10.4802
  - Position vs EMA50: ABOVE
  - 20-day ROC: +2.70%
  - 50-day ROC: +4.49%
  → Preference for risky assets vs safe haven

Gold/USD:
  - Component score: 55.0/100
  - Current value: 47.6225
  - Position vs EMA50: BELOW
  - 20-day ROC: +4.25%
  - 50-day ROC: -7.87%

Oil/Gold:
  - Component score: 95.0/100
  - Current value: 0.0204
  - Position vs EMA50: ABOVE
  - 20-day ROC: +2.62%
  - 50-day ROC: +59.37%
  → Rising energy demand

SP500/VIX:
  - Component score: 95.0/100
  - Current value: 368.1202
  - Position vs EMA50: ABOVE
  - 20-day ROC: +41.45%
  - 50-day ROC: -5.66%
  → Expanding risk appetite

Commodities/T30y:
  - Component score: 95.0/100
  - Current value: 0.3453
  - Position vs EMA50: ABOVE
  - 20-day ROC: +6.04%
  - 50-day ROC: +25.73%
  → Economic growth expectations

SP500/Nasdaq:
  - Component score: 0.0/100
  - Current value: 0.2909
  - Position vs EMA50: BELOW
  - 20-day ROC: -3.23%
  - 50-day ROC: -3.20%
  - ⚠️ ANOMALY DETECTED - Significant deviation from the mean

============================================================
CONCLUSIONS AND RECOMMENDATIONS
============================================================

The market shows signs of broad strength. Intermarket ratios suggest
a risk-friendly environment. Elevated risk appetite and positive trends.
Positioning: CONSTRUCTIVE on risky assets.


STRONGEST RATIOS:
  • Oil/Gold: 95.0/100
  • SP500/VIX: 95.0/100
  • Commodities/T30y: 95.0/100

WEAKEST RATIOS:
  • DJ/Gold: 65.0/100
  • Gold/USD: 55.0/100
  • SP500/Nasdaq: 0.0/100

============================================================
Analysis automatically generated by kbmeter.com
Date: 2026-04-24
📄 Detailed Asset Allocation Analysis
ASSET ALLOCATION & REGIME ANALYSIS - 2026-04-24
======================================================================
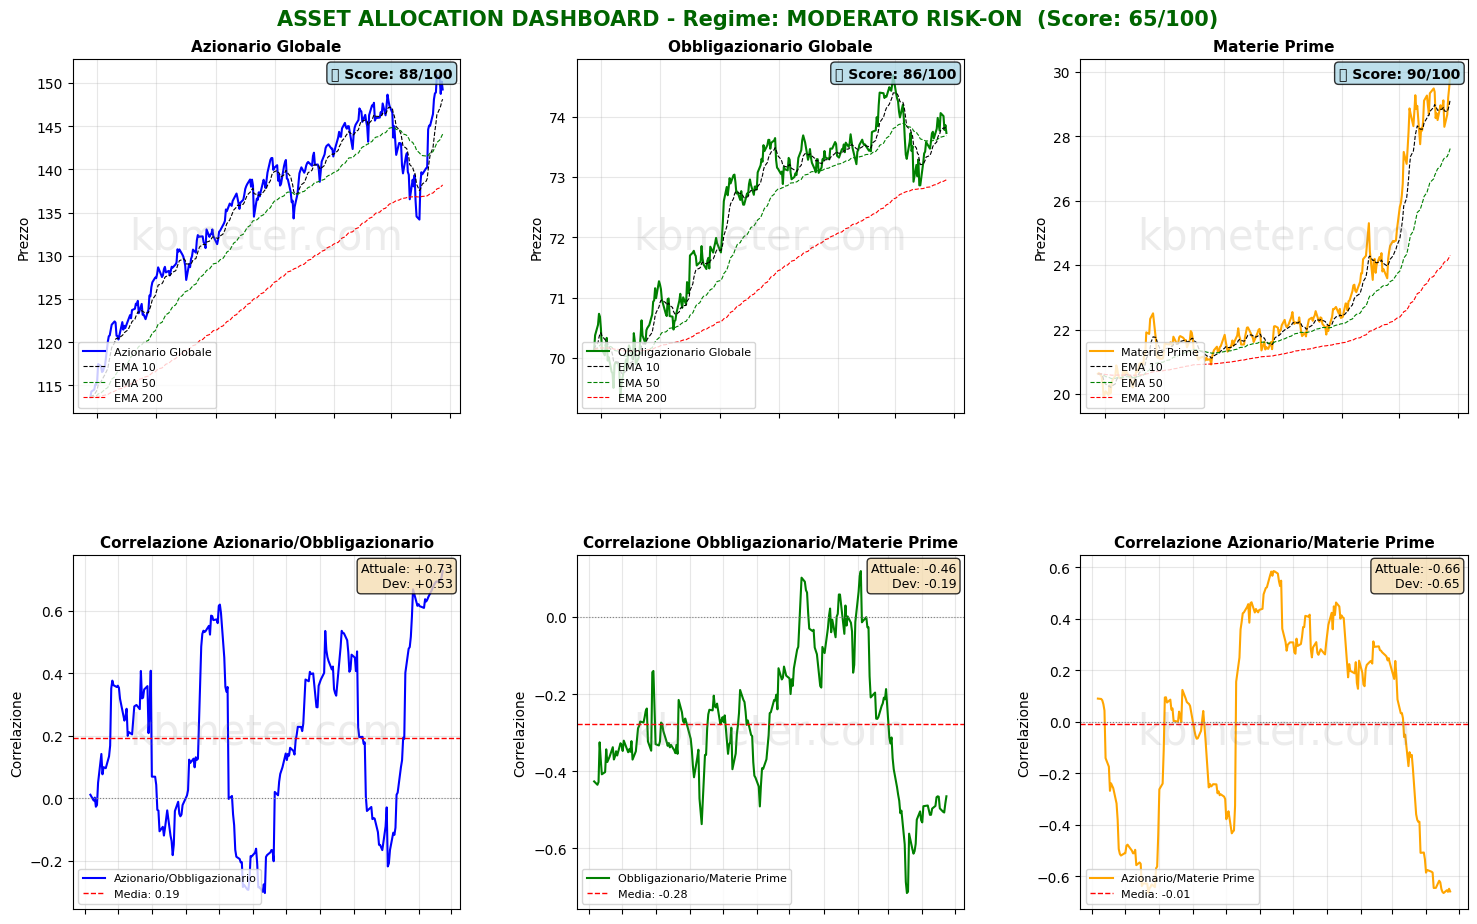
MARKET REGIME: MODERATE RISK-ON
REGIME SCORE: 65.0/100
======================================================================
TREND AND VOLATILITY ANALYSIS
======================================================================
GLOBAL EQUITIES (ACWI):
Short-Term Trend (5d): -1.09% | ABOVE EMA 10
Medium-Term Trend (20d): +9.44% | ABOVE EMA 50
Long-Term Trend (60d): +1.64% | ABOVE EMA 200
Volatility 5d: 16.7%
Volatility 20d: 20.5%
Volatility 60d: 17.6%
COMMODITIES (DBC):
Medium-Term Trend (20d): +5.10% | ABOVE EMA 50
Volatility 20d: 23.0%
ACWI/BND Correlation (30d): 0.727
REGIME INTERPRETATION:
The market shows a risk-on bias, but with some elements of caution.
The trend is constructive, though there may be mixed signals across certain time horizons.
Suggested positioning: BALANCED with a slight tilt toward risk assets.
======================================================================
ASSET RANKING - WHO’S PERFORMING BEST?
======================================================================
🥇 1. Commodities (DBC) - SCORE: 90/100
Price: $29.89
Trend: ABOVE EMA10 | ABOVE EMA50 | ABOVE EMA200
Performance: 5d +5.66% | 20d +5.10% | 60d +19.85%
Volatility: 5d 30.2% | 20d 23.0% | 60d 26.5%
Drawdown: 0.00%
→ Asset in STRONG HEALTH: positive trends and controlled volatility
🥈 2. Global Equities (ACWI) - SCORE: 88/100
Price: $149.25
Trend: ABOVE EMA10 | ABOVE EMA50 | ABOVE EMA200
Performance: 5d -1.09% | 20d +9.44% | 60d +1.64%
Volatility: 5d 16.7% | 20d 20.5% | 60d 17.6%
Drawdown: -1.09%
→ Asset in STRONG HEALTH: positive trends and controlled volatility
🥉 3. Global Bonds (BND) - SCORE: 86/100
Price: $73.73
Trend: BELOW EMA10 | ABOVE EMA50 | ABOVE EMA200
Performance: 5d -0.45% | 20d +1.19% | 60d +0.27%
Volatility: 5d 4.3% | 20d 4.0% | 60d 4.2%
Drawdown: -1.28%
→ Asset in STRONG HEALTH: positive trends and controlled volatility
======================================================================
CORRELATION ANALYSIS - CURRENT vs HISTORICAL
======================================================================
ACWI/BND:
Current Correlation (30d): +0.727
Historical Average (1 year): +0.194
Deviation: +0.533
⚠️ SIGNIFICANT DEVIATION from historical average
→ Positive correlation: diversification COMPROMISED
BND/DBC:
Current Correlation (30d): -0.465
Historical Average (1 year): -0.276
Deviation: -0.189
ACWI/DBC:
Current Correlation (30d): -0.659
Historical Average (1 year): -0.008
Deviation: -0.652
⚠️ SIGNIFICANT DEVIATION from historical average
→ Negative correlation: possible supply-driven shift
======================================================================
OPERATIONAL SUMMARY
======================================================================
STRONGEST ASSET: Commodities (Score: 90/100)
WEAKEST ASSET: Global Bonds (Score: 86/100)
SUGGESTED ACTION: Favor the strongest asset, maintain risk exposure.
DIVERSIFICATION: WEAK - Asset classes tend to move together.
======================================================================
Analysis automatically generated by kbmeter.com
Date: 2026-04-24
Macroeconomic calendar
On the macro front, today’s agenda includes Japan’s March inflation data, Germany’s Ifo index, UK retail sales for March, and the final April reading of US consumer confidence (University of Michigan).
On the earnings front, today the focus is on P&G and Eni.
Already a subscriber? Login here
NOTES AND WARNINGS
Data compiled by kbmeter.com. Analysis date: 24 April 2026 - 7:39 AM GMT+1
This content is provided for informational purposes only and should not be considered financial advice. All scores and assessments are based on the previous trading day’s closing prices. Futures indications refer to the date and time of the analysis.