Markets Brace for Eventful Week as Eurozone Inflation, Central Banks and Mag7 Earnings Take Center Stage
The week starting today is shaping up to be particularly interesting from both a macroeconomic perspective (April inflation in the Eurozone, policy meetings of the ECB, BoJ, and Fed) and a microeconomic one (earnings reports from five of the Magnificent 7). Financial markets will try to find the right catalyst to regain some of the directionality that has faded in recent sessions.
The opening sentiment is neutral, with volatility remaining at elevated levels, although supported by ongoing risk-on positioning. Above all, as has been the case for several weeks, geopolitical developments remain the key focus. The stalemate in the Middle East is now being viewed with greater optimism, as dialogue between the parties appears not to have broken down. Futures indicate a moderately positive start for both Europe and the United States.
Market Weather Map
April 27, 2026
US Equities
Eu Equities
Asia Equities
Commodities
Bonds
Dollar Index
Technology
Gold
Oil
Crypto
Market Summary
Financial markets sentiment
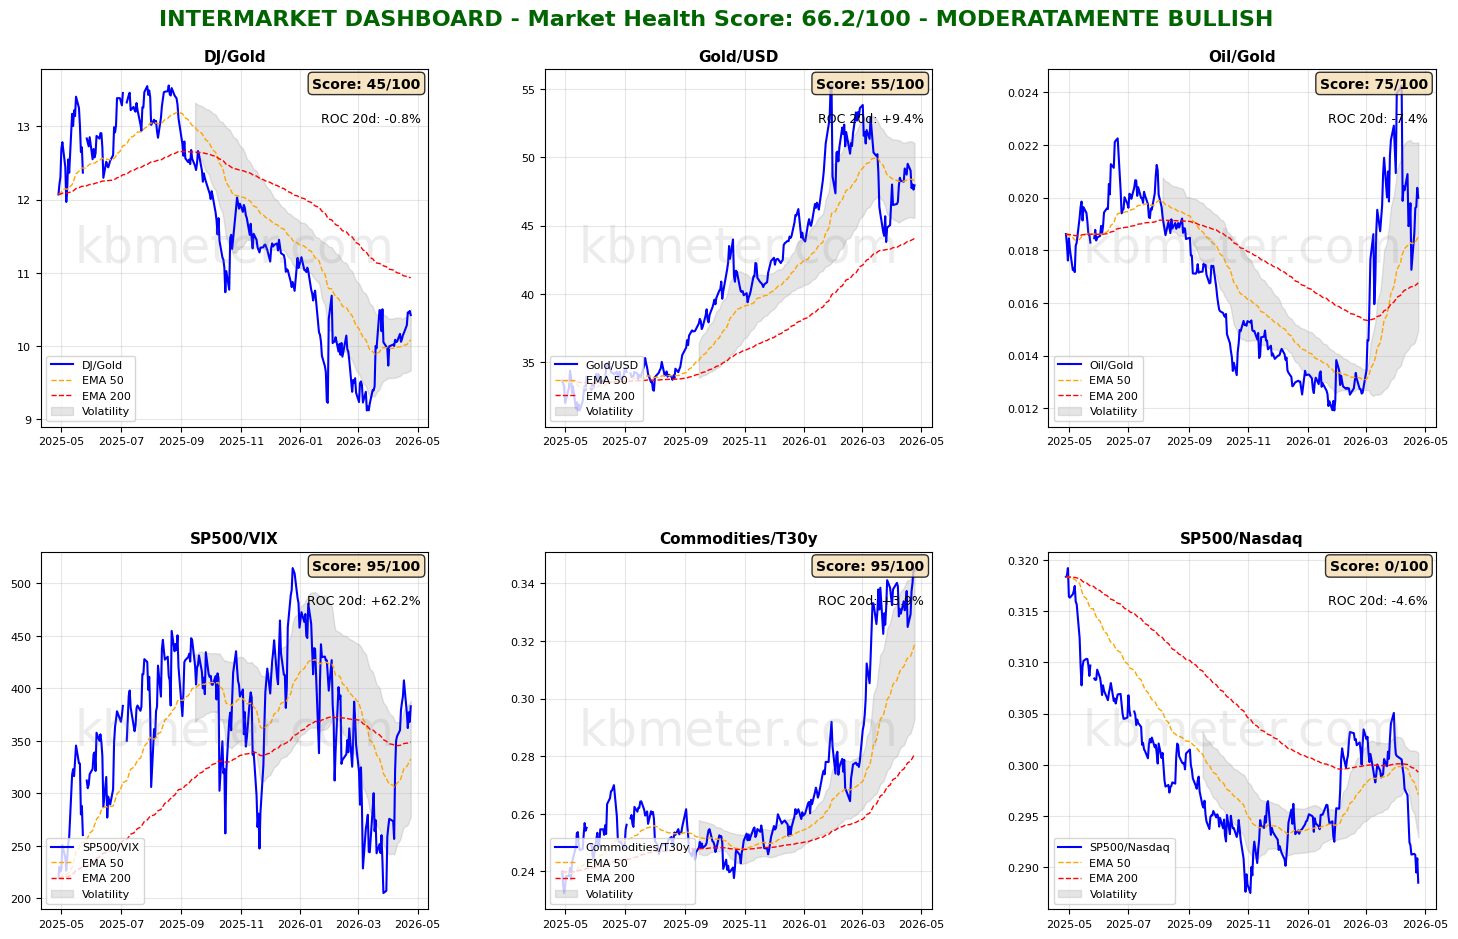
Financial markets are showing a neutral sentiment today. Intermarket analysis highlights a Market Health Score of 66/100 (positive). Our intermarket dashboards confirm a neutral sentiment reading, with risk appetite indicators remaining in positive territory but compressed in recent sessions. The Oil/Gold ratio is showing some volatility, while the Commodities/30Y Treasury ratio remains at period highs.
Conditions across asset classes remain stable, with global equities and bonds staying above their 50-day moving averages and showing signs of consolidation.
As for our market weather map, we note the moderately positive positioning of the technology sector (during this key earnings week). No asset has yet moved above the 60-point threshold.
Global Futures – Pre-Market Sentiment
Pre-Market Futures: Global futures point to a moderate risk-on sentiment (+0.21% on average), with the US slightly positive (+0.08%), Europe slightly positive (+0.21%), and Asia slightly positive (+0.37%).
📊 Global Futures – Pre-Market Sentiment
- Nikkei 225 derived: +1.35%
- TecDAX derived: +0.63%
- Mini DAX: +0.40%
- FTSE MIB derived: -0.55%
- Dow Jones 30 cv1: -0.20%
- Hang Seng derived: -0.18%
Intermarket details
📄 Detailed Intermarket Analysis
INTERMARKET ANALYSIS - 2026-04-27
============================================================

MARKET HEALTH SCORE: 66.2/100
SENTIMENT: MODERATELY BULLISH

============================================================
MAIN RATIOS SUMMARY
============================================================


DJ/Gold:
  - Component score: 45.0/100
  - Current value: 10.4252
  - Position vs EMA50: ABOVE
  - 20-day ROC: -0.75%
  - 50-day ROC: +5.49%
  → Preference for risk assets vs safe havens

Gold/USD:
  - Component score: 55.0/100
  - Current value: 47.9373
  - Position vs EMA50: BELOW
  - 20-day ROC: +9.45%
  - 50-day ROC: -8.48%

Oil/Gold:
  - Component score: 75.0/100
  - Current value: 0.0200
  - Position vs EMA50: ABOVE
  - 20-day ROC: -7.42%
  - 50-day ROC: +56.87%
  → Declining energy demand

SP500/VIX:
  - Component score: 95.0/100
  - Current value: 382.9546
  - Position vs EMA50: ABOVE
  - 20-day ROC: +62.24%
  - 50-day ROC: -2.63%
  → Expanding risk appetite

Commodities/T30y:
  - Component score: 95.0/100
  - Current value: 0.3444
  - Position vs EMA50: ABOVE
  - 20-day ROC: +3.85%
  - 50-day ROC: +23.53%
  → Economic growth expectations

SP500/Nasdaq:
  - Component score: 0.0/100
  - Current value: 0.2885
  - Position vs EMA50: BELOW
  - 20-day ROC: -4.65%
  - 50-day ROC: -4.14%
  - ⚠️ ANOMALY DETECTED - Significant deviation from the average

============================================================
CONCLUSIONS AND RECOMMENDATIONS
============================================================

The market is moderately constructive. Some ratios show positive signals
but caution remains warranted. Monitor developments.
Positioning: SELECTIVE, favor quality.


STRONGEST RATIOS:
  • SP500/VIX: 95.0/100
  • Commodities/T30y: 95.0/100
  • Oil/Gold: 75.0/100

WEAKEST RATIOS:
  • Gold/USD: 55.0/100
  • DJ/Gold: 45.0/100
  • SP500/Nasdaq: 0.0/100

============================================================
Analysis automatically generated by kbmeter.com
Date: 2026-04-27
📄 Detailed Asset Allocation Analysis
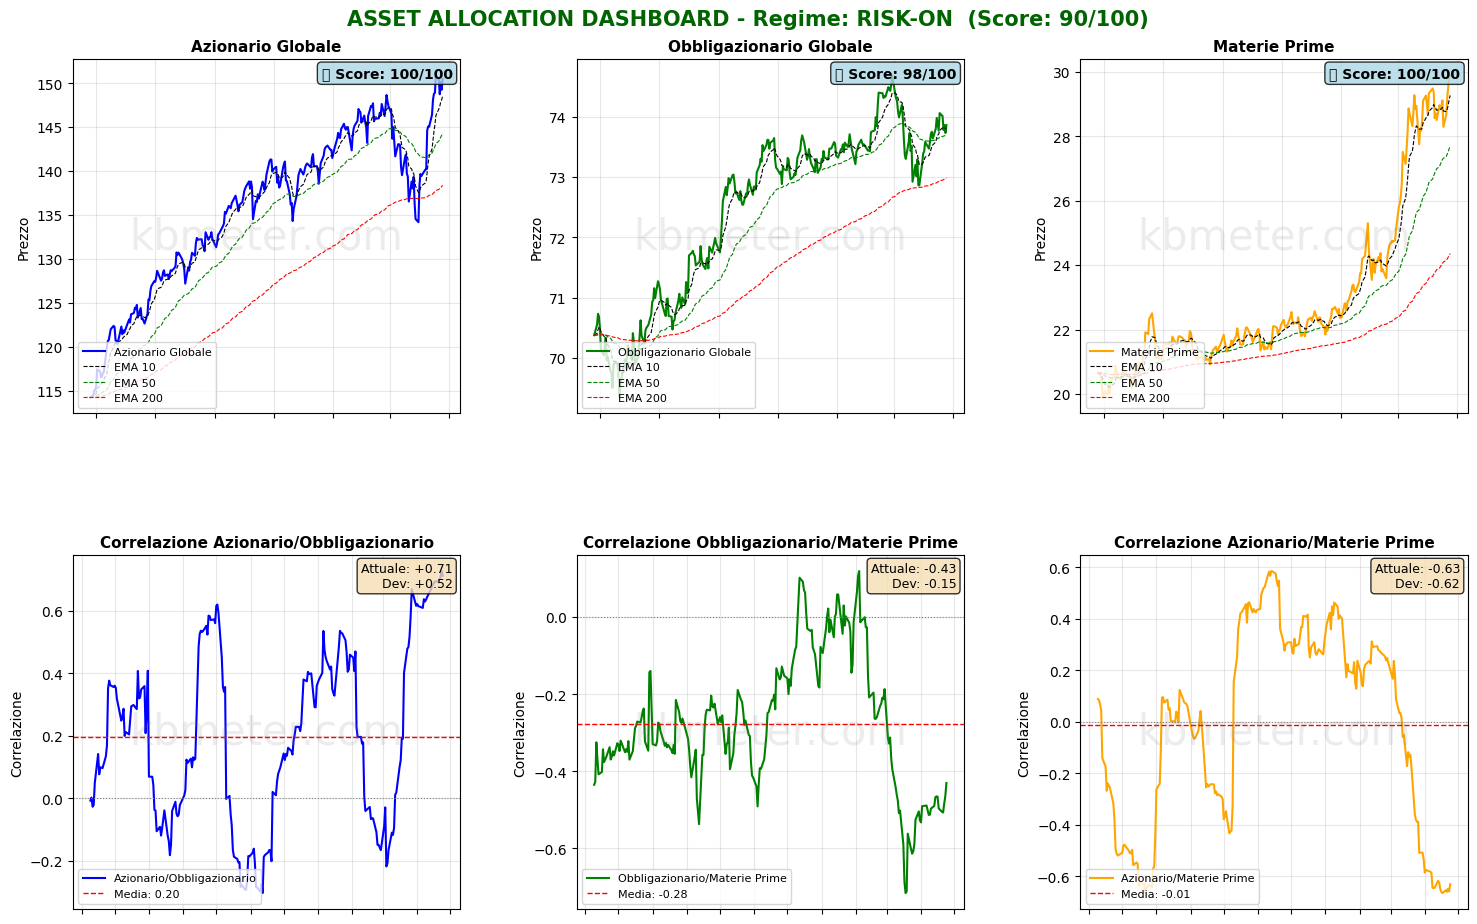
ASSET ALLOCATION & REGIME ANALYSIS - 2026-04-27
======================================================================

MARKET REGIME: RISK-ON
REGIME SCORE: 90.0/100

======================================================================
TREND AND VOLATILITY ANALYSIS
======================================================================

GLOBAL EQUITIES (ACWI):
  Short-Term Trend (5d): +0.05% | ABOVE EMA 10
  Medium-Term Trend (20d): +11.85% | ABOVE EMA 50
  Long-Term Trend (60d): +2.58% | ABOVE EMA 200

  5d Volatility: 14.5%
  20d Volatility: 18.3%
  60d Volatility: 17.7%

COMMODITIES (DBC):
  Medium-Term Trend (20d): +2.61% | ABOVE EMA 50
  20d Volatility: 23.0%

ACWI/BND Correlation (30d): 0.713

REGIME INTERPRETATION:
The market is in a risk-on regime. Equities show positive trends across multiple time
horizons and volatility remains contained. Investors are favoring risk assets.
Suggested positioning: OVERWEIGHT equities.

======================================================================
ASSET RANKING - WHO IS DOING BEST?
======================================================================

🥇 1. Global Equities (ACWI) - SCORE: 100/100
     Price: $150.49
     Trend: ABOVE EMA10 | ABOVE EMA50 | ABOVE EMA200
     Performance: 5d +0.05% | 20d +11.85% | 60d +2.58%
     Volatility: 5d 14.5% | 20d 18.3% | 60d 17.7%
     Drawdown: -0.27%
     → Asset in STRONG HEALTH: positive trends and controlled volatility

🥈 2. Commodities (DBC) - SCORE: 100/100
     Price: $29.86
     Trend: ABOVE EMA10 | ABOVE EMA50 | ABOVE EMA200
     Performance: 5d +4.15% | 20d +2.61% | 60d +18.02%
     Volatility: 5d 11.6% | 20d 23.0% | 60d 26.5%
     Drawdown: -0.10%
     → Asset in STRONG HEALTH: positive trends and controlled volatility

🥉 3. Global Bonds (BND) - SCORE: 98/100
     Price: $73.86
     Trend: ABOVE EMA10 | ABOVE EMA50 | ABOVE EMA200
     Performance: 5d -0.20% | 20d +1.37% | 60d +0.44%
     Volatility: 5d 3.2% | 20d 3.3% | 60d 4.2%
     Drawdown: -1.11%
     → Asset in STRONG HEALTH: positive trends and controlled volatility

======================================================================
CORRELATION ANALYSIS - CURRENT vs HISTORICAL
======================================================================

ACWI/BND:
  Current correlation (30d): +0.713
  Historical average (1 year): +0.198
  Deviation: +0.515
  ⚠️ SIGNIFICANT DEVIATION from historical average
  → Positive correlation: diversification IMPAIRED

BND/DBC:
  Current correlation (30d): -0.430
  Historical average (1 year): -0.276
  Deviation: -0.154

ACWI/DBC:
  Current correlation (30d): -0.631
  Historical average (1 year): -0.011
  Deviation: -0.620
  ⚠️ SIGNIFICANT DEVIATION from historical average
  → Negative correlation: possible supply-driven shift

======================================================================
OPERATIONAL SUMMARY
======================================================================

STRONGEST ASSET: Global Equities (Score: 100/100)
WEAKEST ASSET: Global Bonds (Score: 98/100)

SUGGESTED ACTION: Favor the strongest asset, maintain risk exposure.
DIVERSIFICATION: GOOD - Diversification benefits remain present.

======================================================================
Analysis automatically generated by kbmeter.com
Date: 2026-04-27
Macroeconomic calendar
On the macro front, the week begins with few major catalysts, although updates on German consumer confidence and the Dallas Fed Manufacturing Index for April are worth noting.
On the earnings front, the key days will be Wednesday and Thursday, with results from five of the Magnificent 7. Today, the spotlight is on earnings from Verizon and Hitachi.
Already a subscriber? Login here
NOTES AND WARNINGS
Data compiled by kbmeter.com. Analysis date: 27 April 2026 - 7:31 AM GMT+1
This content is provided for informational purposes only and should not be considered financial advice. All scores and assessments are based on the previous trading day’s closing prices. Futures indications refer to the date and time of the analysis.