Investors Shrug Off Nvidia Earnings as Markets Maintain Risk-On Tone
Positive, but not positive enough. That was the market’s verdict on Nvidia’s quarterly earnings. It is an attitude that does not ignite investor sentiment, but it does reinforce a phase of moderate risk-on positioning. With the focus shifting back to profits, pressure on the bond market is easing slightly, while the dollar continues to strengthen. Futures point to a positive open for Europe and a flat start for the United States.
Market Weather Map
May 21, 2026
US Equities
Eu Equities
Asia Equities
Commodities
Bonds
Dollar Index
Technology
Gold
Oil
Crypto
Market Summary
Do you want to see the score details for all assets monitored by KBMeter?
Try free for 14 days →Financial markets sentiment
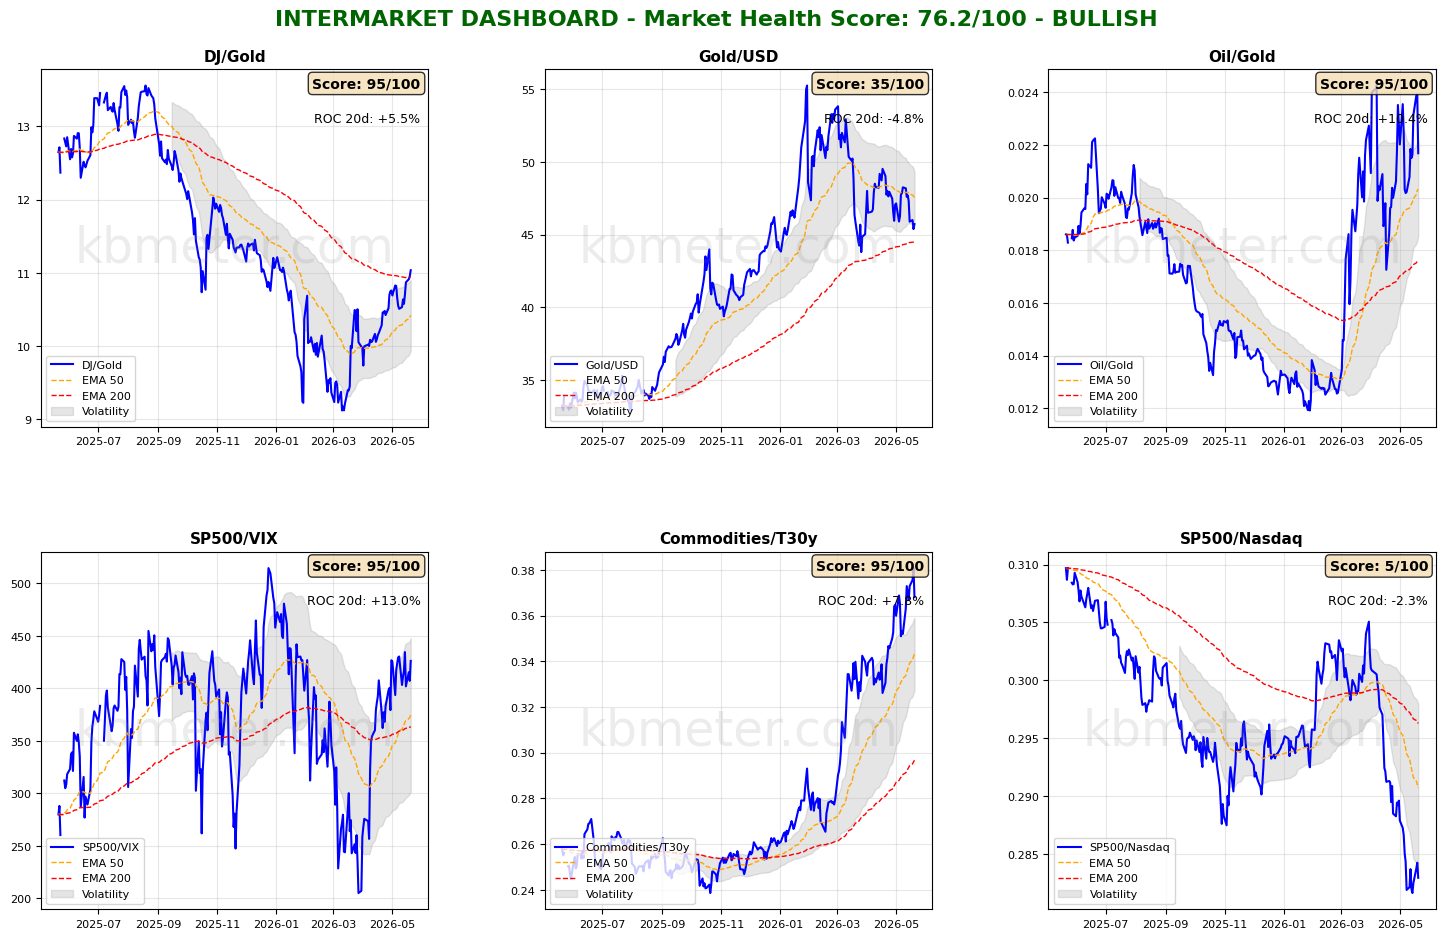
Financial markets are showing a moderately positive sentiment today. Intermarket analysis indicates a Market Health Score of 76/100 (positive). Our intermarket dashboards signal a broadly stable situation compared with yesterday’s analysis.
The Dow/Gold ratio has broken above the resistance represented by the long-term moving average, a signal that — if confirmed — could strengthen the current risk-on sentiment in the markets. Meanwhile, the Gold/Dollar ratio is approaching its long-term moving average, which in this case acts as support; this will need to be monitored closely.
As for asset classes, bonds have moved back above their medium-term moving average, in a session where upward pressure on yields has — at least temporarily — cooled.
Global Futures – Pre-Market Sentiment
Pre-Market Futures: Global futures are signaling a risk-on sentiment (+0.56% on average), with the U.S. slightly positive (+0.01%), Europe positive (+0.92%), and Asia slightly positive (+0.18%).
📊 Global Futures – Pre-Market Sentiment
- TecDAX derived: +4.34%
- IBEX 35 derived: +1.91%
- FTSE MIB derived: +1.71%
- Hang Seng derived: -0.77%
- FTSE 100 derived: -0.10%
- Dow Jones: -0.06%
Intermarket details
📄 Detailed Intermarket Analysis
INTERMARKET ANALYSIS - 2026-05-21
============================================================

MARKET HEALTH SCORE: 76.2/100
SENTIMENT: BULLISH

============================================================
SUMMARY OF MAIN RATIOS
============================================================


DJ/Gold:
  - Component score: 95.0/100
  - Current value: 11.0364
  - Position vs EMA50: ABOVE
  - 20-day ROC: +5.54%
  - 50-day ROC: +20.98%
  → Preference for risk assets over safe havens

Gold/USD:
  - Component score: 35.0/100
  - Current value: 45.7199
  - Position vs EMA50: BELOW
  - 20-day ROC: -4.75%
  - 50-day ROC: -13.60%

Oil/Gold:
  - Component score: 95.0/100
  - Current value: 0.0217
  - Position vs EMA50: ABOVE
  - 20-day ROC: +10.39%
  - 50-day ROC: +35.90%
  → Rising energy demand

SP500/VIX:
  - Component score: 95.0/100
  - Current value: 426.2024
  - Position vs EMA50: ABOVE
  - 20-day ROC: +12.97%
  - 50-day ROC: +56.68%
  → Expanding risk appetite

Commodities/T30y:
  - Component score: 95.0/100
  - Current value: 0.3680
  - Position vs EMA50: ABOVE
  - 20-day ROC: +7.77%
  - 50-day ROC: +16.81%
  → Economic growth expectations

SP500/Nasdaq:
  - Component score: 5.0/100
  - Current value: 0.2829
  - Position vs EMA50: BELOW
  - 20-day ROC: -2.26%
  - 50-day ROC: -5.30%

============================================================
CONCLUSIONS AND RECOMMENDATIONS
============================================================

The market is showing signs of broad-based strength. Intermarket ratios suggest
a risk-friendly environment. Elevated risk appetite and positive trends.
Positioning: CONSTRUCTIVE on risk assets.


STRONGEST RATIOS:
  • DJ/Gold: 95.0/100
  • Oil/Gold: 95.0/100
  • SP500/VIX: 95.0/100

WEAKEST RATIOS:
  • Commodities/T30y: 95.0/100
  • Gold/USD: 35.0/100
  • SP500/Nasdaq: 5.0/100

============================================================
Data processed by kbmeter.com
Date: 2026-05-21
📄 Detailed Asset Allocation Analysis
ASSET ALLOCATION & REGIME ANALYSIS - 2026-05-21
======================================================================
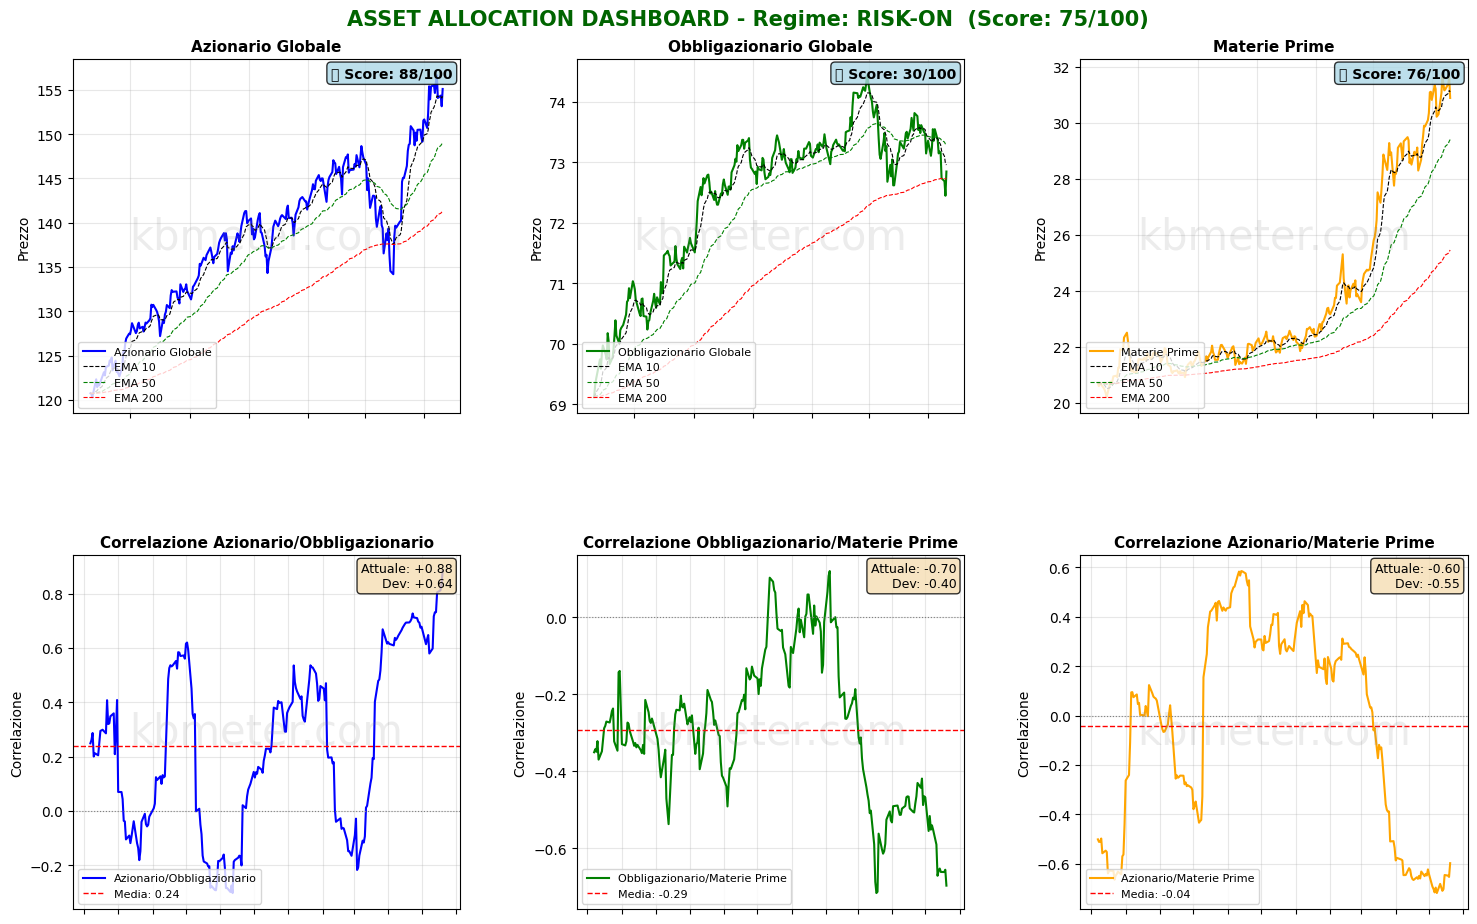
MARKET REGIME: RISK-ON
REGIME SCORE: 75.0/100
======================================================================
TREND AND VOLATILITY ANALYSIS
======================================================================
GLOBAL EQUITIES (ACWI):
Short-Term Trend (5d): -0.99% | ABOVE EMA 10
Medium-Term Trend (20d): +3.92% | ABOVE EMA 50
Long-Term Trend (60d): +4.34% | ABOVE EMA 200
5d Volatility: 18.0%
20d Volatility: 15.1%
60d Volatility: 18.1%
COMMODITIES (DBC):
Medium-Term Trend (20d): +3.31% | ABOVE EMA 50
20d Volatility: 23.0%
ACWI/BND Correlation (30d): 0.883
REGIME INTERPRETATION:
The market is currently in a risk-on regime. Equities are showing positive trends across multiple
time horizons and volatility remains contained. Investors are favoring risk assets.
Suggested positioning: OVERWEIGHT equities.
======================================================================
ASSET RANKING - WHO IS PERFORMING BEST?
======================================================================
🥇 1. Global Equities (ACWI) - SCORE: 88/100
Price: $155.10
Trend: ABOVE EMA10 | ABOVE EMA50 | ABOVE EMA200
Performance: 5d -0.99% | 20d +3.92% | 60d +4.34%
Volatility: 5d 18.0% | 20d 15.1% | 60d 18.1%
Drawdown: -0.99%
→ Asset in STRONG HEALTH: positive trends and controlled volatility
🥈 2. Commodities (DBC) - SCORE: 76/100
Price: $30.88
Trend: BELOW EMA10 | ABOVE EMA50 | ABOVE EMA200
Performance: 5d -0.87% | 20d +3.31% | 60d +24.77%
Volatility: 5d 19.9% | 20d 23.0% | 60d 24.9%
Drawdown: -2.56%
→ Asset in STRONG HEALTH: positive trends and controlled volatility
🥉 3. Global Bonds (BND) - SCORE: 30/100
Price: $72.85
Trend: BELOW EMA10 | BELOW EMA50 | ABOVE EMA200
Performance: 5d -0.42% | 20d -0.87% | 60d -1.80%
Volatility: 5d 6.7% | 20d 4.7% | 60d 4.6%
Drawdown: -2.14%
→ Asset in WEAK CONDITIONS: negative trends or elevated volatility
======================================================================
CORRELATION ANALYSIS - CURRENT vs HISTORICAL
======================================================================
ACWI/BND:
Current correlation (30d): +0.883
Historical average (1 year): +0.241
Deviation: +0.643
⚠️ SIGNIFICANT DEVIATION from historical average
→ Positive correlation: diversification COMPROMISED
BND/DBC:
Current correlation (30d): -0.697
Historical average (1 year): -0.293
Deviation: -0.404
⚠️ SIGNIFICANT DEVIATION from historical average
ACWI/DBC:
Current correlation (30d): -0.597
Historical average (1 year): -0.043
Deviation: -0.555
⚠️ SIGNIFICANT DEVIATION from historical average
→ Negative correlation: possible supply-driven shift
======================================================================
OPERATIONAL SUMMARY
======================================================================
STRONGEST ASSET: Global Equities (Score: 88/100)
WEAKEST ASSET: Global Bonds (Score: 30/100)
SUGGESTED ACTION: Favor the strongest asset, maintain risk exposure.
DIVERSIFICATION: POOR - Asset classes tend to move together.
======================================================================
Data processed by kbmeter.com
Date: 2026-05-21
Macroeconomic calendar
On the macro front, today brings the release of the flash estimates for May PMI surveys, an important indicator for measuring how the energy crisis is spreading through the economy. Also important are the Philadelphia Fed data in the United States and consumer confidence figures in the Eurozone.
Already a subscriber? Login here
NOTES AND WARNINGS
Data compiled by kbmeter.com. Analysis date: 21 May 2026 - 9:45 AM GMT+1
This content is provided for informational purposes only and should not be considered financial advice. All scores and assessments are based on the previous trading day’s closing prices. Futures indications refer to the date and time of the analysis.