Greenland tensions fade as markets refocus on U.S. macro data and the Fed
Real economy data return to the forefront of the market debate. With the Greenland issue fading into the background, investors are refocusing on hard macro signals, including US personal consumption data, the Supreme Court’s considerations in the Cook (Fed) case, and the ongoing earnings season, with Intel reporting today.
Market Weather Map
January 22, 2026
US Equities
Eu Equities
Asia Equities
Commodities
Bonds
Dollar Index
Technology
Gold
Oil
Crypto
Market Summary
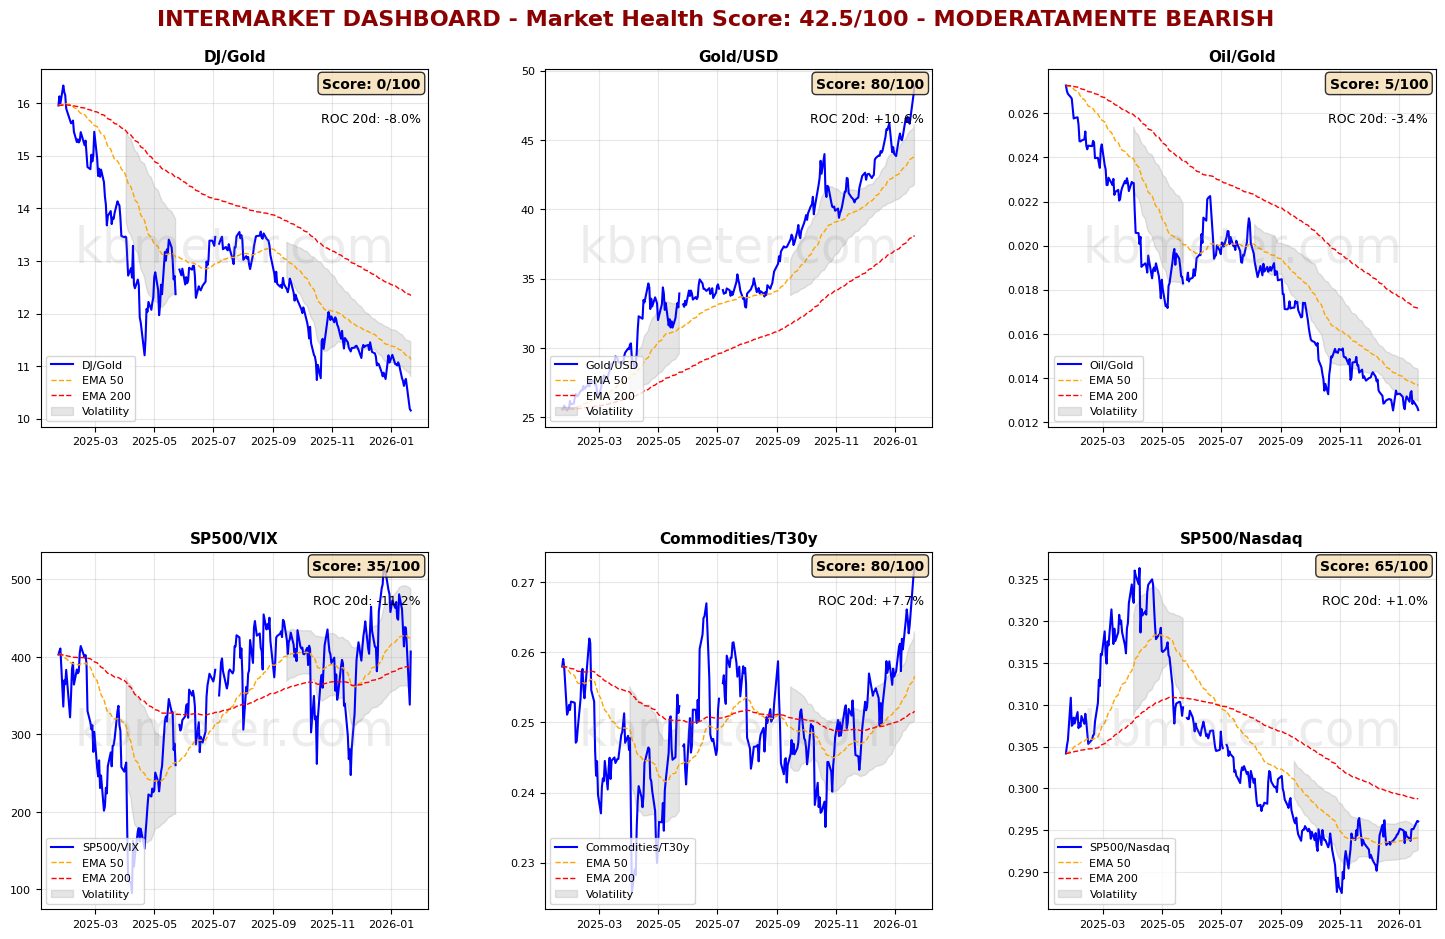
Overall sentiment remains fragile, although futures point to a rebound at the start of the trading session. Financial markets are showing a moderately positive tone, while intermarket analysis highlights a Market Health Score of 42/100, still in moderately negative territory. From a thematic perspective, cryptocurrencies remain under pressure, with a weak score of 34.
Our intermarket dashboards continue to signal persistent risk-off dynamics, with gold strengthening further against both the Dow and the US dollar, while key risk ratios remain trapped in a phase of elevated volatility. Across major asset classes, we note an ongoing recovery in both equities and bonds, while commodities are benefiting from renewed strength in precious metals.
Volatility has eased back to moderate levels. Close monitoring of macro developments and the emergence of new catalysts remains essential.
Pre-Market Futures: Global futures point to a moderate risk-on bias (+0.34% on average), with US markets slightly positive (+0.12%), Europe moderately higher (+0.42%), and Asia also edging up (+0.37%).
📊 Global Futures – Pre-Market Sentiment
- Mini DAX: +1.13%
- DAX (derived): +1.05%
- Euro Stoxx 50 (derived): +1.02%
- FTSE MIB (derived): -0.51%
- Hang Seng (derived): -0.31%
- CAC 40 (derived): -0.05%
📄 Detailed Intermarket Analysis
INTERMARKET ANALYSIS - 2026-01-22
============================================================

MARKET HEALTH SCORE: 42.5/100
SENTIMENT: MODERATELY BEARISH

============================================================
SUMMARY OF KEY RATIOS
============================================================


DJ/Gold:
  - Component score: 0.0/100
  - Current value: 10.1571
  - Position vs EMA50: BELOW
  - 20-day ROC: -7.97%
  - 50-day ROC: -13.83%
  - ⚠️ ANOMALY DETECTED – Significant deviation from the mean
  → Flight to safe havens

Gold/USD:
  - Component score: 80.0/100
  - Current value: 48.9247
  - Position vs EMA50: ABOVE
  - 20-day ROC: +10.61%
  - 50-day ROC: +22.60%
  - ⚠️ ANOMALY DETECTED – Significant deviation from the mean

Oil/Gold:
  - Component score: 5.0/100
  - Current value: 0.0125
  - Position vs EMA50: BELOW
  - 20-day ROC: -3.43%
  - 50-day ROC: -15.98%
  → Weakening energy demand

SP500/VIX:
  - Component score: 35.0/100
  - Current value: 406.8414
  - Position vs EMA50: BELOW
  - 20-day ROC: -11.24%
  - 50-day ROC: +18.05%
  → Contracting risk appetite

Commodities/T30y:
  - Component score: 80.0/100
  - Current value: 0.2720
  - Position vs EMA50: ABOVE
  - 20-day ROC: +7.73%
  - 50-day ROC: +9.63%
  - ⚠️ ANOMALY DETECTED – Significant deviation from the mean
  → Economic growth expectations

SP500/Nasdaq:
  - Component score: 65.0/100
  - Current value: 0.2960
  - Position vs EMA50: ABOVE
  - 20-day ROC: +0.96%
  - 50-day ROC: +1.56%

============================================================
CONCLUSIONS AND RECOMMENDATIONS
============================================================

The market shows signs of weakness. Several ratios remain in negative territory.
Risk appetite is declining. Increase caution.
Positioning: DEFENSIVE, favor safe-haven assets.


STRONGEST RATIOS:
  • Gold/USD: 80.0/100
  • Commodities/T30y: 80.0/100
  • SP500/Nasdaq: 65.0/100

WEAKEST RATIOS:
  • SP500/VIX: 35.0/100
  • Oil/Gold: 5.0/100
  • DJ/Gold: 0.0/100

============================================================
Analysis automatically generated by kbmeter.com
Date: 2026-01-22
📄 Detailed Asset Allocation Analysis
ASSET ALLOCATION & REGIME ANALYSIS - 2026-01-22
======================================================================
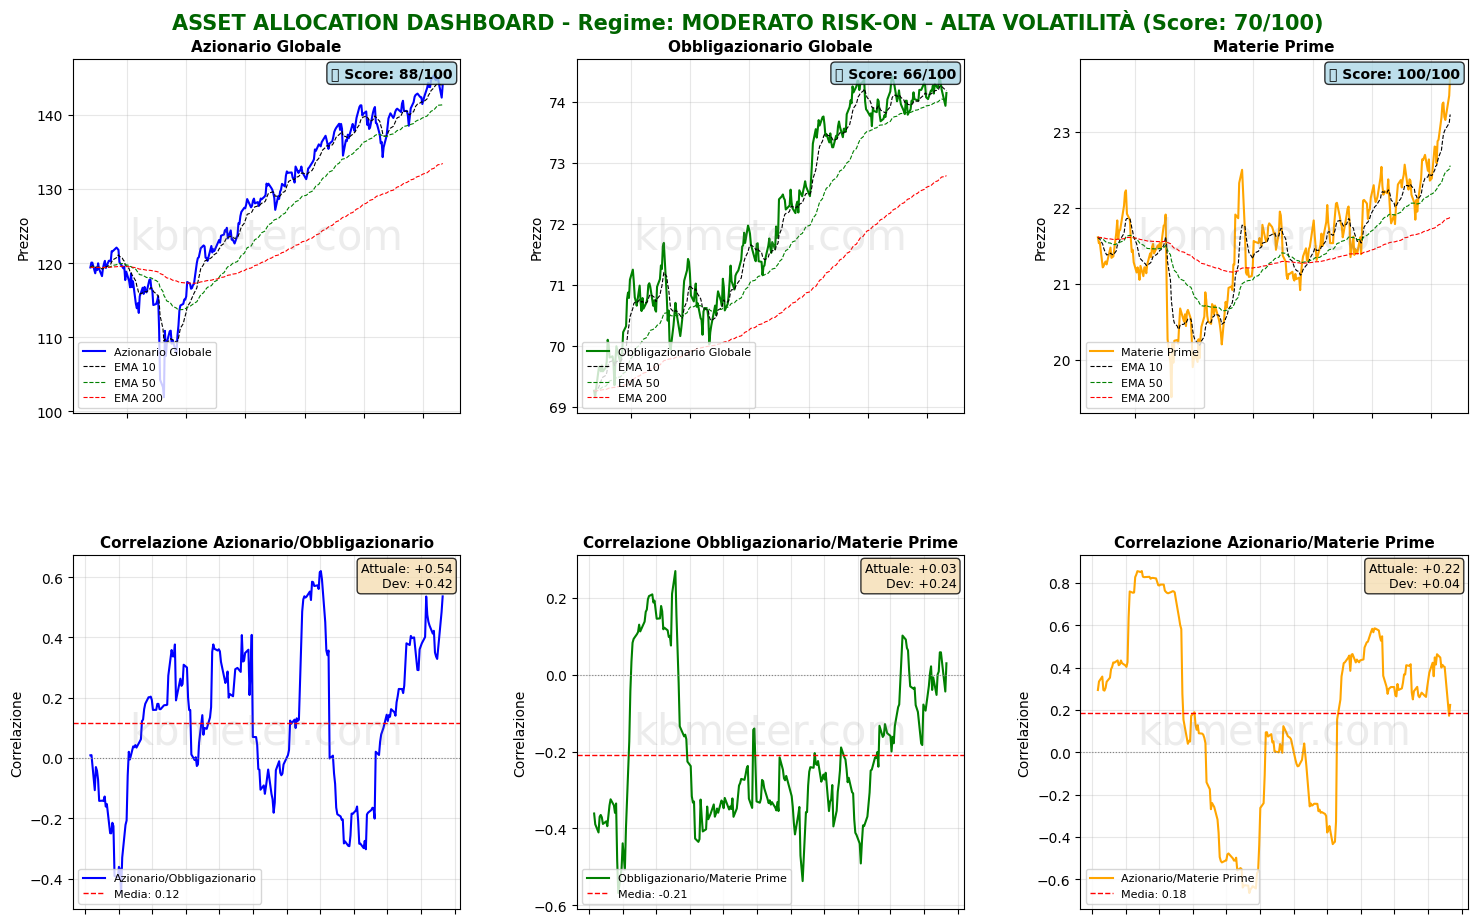
MARKET REGIME: MODERATE RISK-ON – HIGH VOLATILITY
REGIME SCORE: 70.0/100
======================================================================
TREND AND VOLATILITY ANALYSIS
======================================================================
GLOBAL EQUITIES (ACWI):
Short-Term Trend (5d): -0.48% | ABOVE EMA 10
Medium-Term Trend (20d): +1.60% | ABOVE EMA 50
Long-Term Trend (60d): +3.13% | ABOVE EMA 200
5d Volatility: 17.1%
20d Volatility: 10.3%
60d Volatility: 11.5%
COMMODITIES (DBC):
Medium-Term Trend (20d): +6.07% | ABOVE EMA 50
20d Volatility: 14.3%
ACWI/BND Correlation (30d): 0.536
REGIME INTERPRETATION:
The market shows a positive risk appetite, albeit with elements of caution.
The overall trend remains constructive, though mixed signals may emerge across
different time horizons.
Suggested positioning: BALANCED, with a slight tilt toward risk assets.
⚠️ VOLATILITY ALERT: Volatility is elevated or rising rapidly. This increases
risk even in the presence of positive trends. Reduce position sizing and increase
monitoring frequency.
======================================================================
ASSET RANKING – WHO IS PERFORMING BEST?
======================================================================
🥇 1. Commodities (DBC) - SCORE: 100/100
Price: $23.75
Trend: ABOVE EMA10 | ABOVE EMA50 | ABOVE EMA200
Performance: 5d +1.54% | 20d +6.07% | 60d +7.44%
Volatility: 5d 14.6% | 20d 14.3% | 60d 12.5%
Drawdown: 0.00%
→ Asset in STRONG HEALTH: positive trends and controlled volatility
🥈 2. Global Equities (ACWI) - SCORE: 88/100
Price: $144.01
Trend: ABOVE EMA10 | ABOVE EMA50 | ABOVE EMA200
Performance: 5d -0.48% | 20d +1.60% | 60d +3.13%
Volatility: 5d 17.1% | 20d 10.3% | 60d 11.5%
Drawdown: -0.94%
→ Asset in STRONG HEALTH: positive trends and controlled volatility
🥉 3. Global Bonds (BND) - SCORE: 66/100
Price: $74.14
Trend: BELOW EMA10 | ABOVE EMA50 | ABOVE EMA200
Performance: 5d -0.39% | 20d +0.16% | 60d -0.20%
Volatility: 5d 4.3% | 20d 2.8% | 60d 3.0%
Drawdown: -0.39%
→ Asset in FAIR CONDITION: predominantly positive signals
======================================================================
CORRELATION ANALYSIS – CURRENT vs HISTORICAL
======================================================================
ACWI/BND:
Current correlation (30d): +0.536
Historical average (1 year): +0.118
Deviation: +0.419
⚠️ SIGNIFICANT DEVIATION from historical average
→ Positive correlation: diversification COMPROMISED
BND/DBC:
Current correlation (30d): +0.030
Historical average (1 year): -0.209
Deviation: +0.239
ACWI/DBC:
Current correlation (30d): +0.224
Historical average (1 year): +0.184
Deviation: +0.040
======================================================================
OPERATIONAL SUMMARY
======================================================================
STRONGEST ASSET: Commodities (Score: 100/100)
WEAKEST ASSET: Global Bonds (Score: 66/100)
SUGGESTED ACTION: Favor the strongest asset while maintaining exposure to risk.
DIVERSIFICATION: EXCELLENT – Asset classes are moving largely independently.
======================================================================
Analysis automatically generated by kbmeter.com
Date: 2026-01-22
On the macro front, the day features Japanese export data for December 2025, Australian employment figures, and—most importantly—final readings on US economic growth in Q4 2025, alongside personal income and consumption data.
Earnings focus: among today’s key reporters are Procter & Gamble and Intel.
Already a subscriber? Login here
NOTES AND WARNINGS
Data compiled by kbmeter.com. Analysis date: 22 January 2026 - 7:55 AM GMT+1
This content is provided for informational purposes only and should not be considered financial advice. All scores and assessments are based on the previous trading day’s closing prices. Futures indications refer to the date and time of the analysis.