Global Markets Open Week Under Pressure as Risk Metrics Worsen; Stocks, Bonds at Key Support
The week closing March opens with rather discouraging signals for financial markets. The situation in the Middle East appears to be worsening, and signs of dialogue remain very weak for now. Investor sentiment stays between neutral and moderately negative, but risk appetite indicators are deteriorating, volatility remains high, and the global equity and bond environment continues to be fragile.
Although still nuanced, the risk of a capitulation in the face of a further escalation of the conflict—possibly accompanied by negative news on the inflation front (Germany is in focus today) and employment (U.S. March data expected at the end of the week)—is beginning to emerge.
Futures point to a negative opening for both Europe and the United States.
Market Weather Map
March 30, 2026
US Equities
Eu Equities
Asia Equities
Commodities
Bonds
Dollar Index
Technology
Gold
Oil
Crypto
Market Summary
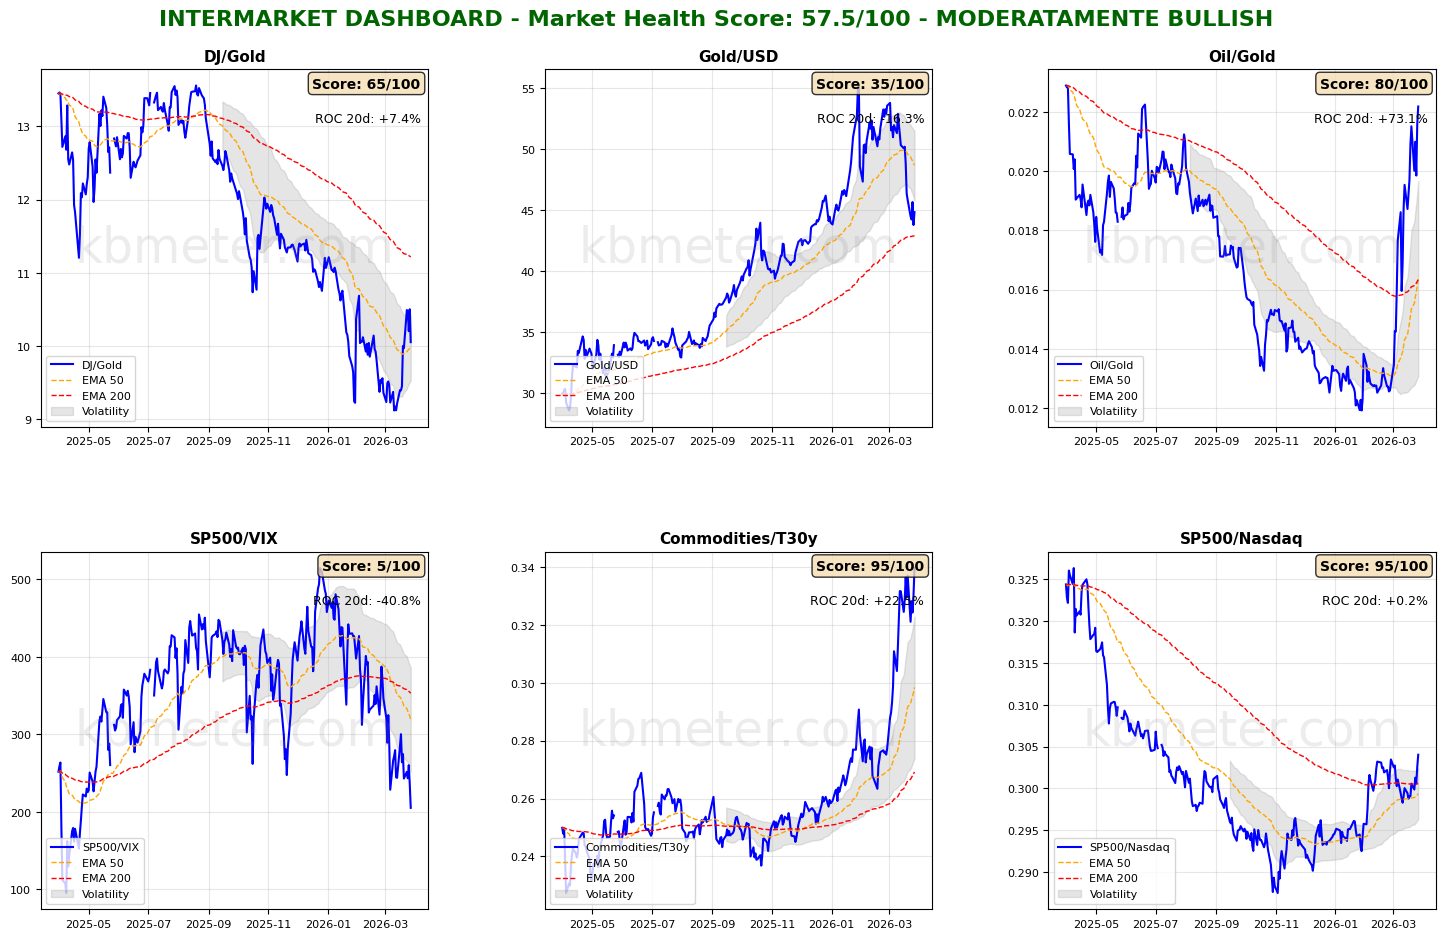
Financial markets today show a moderately negative sentiment. Intermarket analysis highlights a Market Health Score of 58/100 (neutral). Our intermarket dashboards signal a further deterioration in risk appetite indicators, with the S&P 500/VIX ratio falling to levels not seen since May of last year.
Gold is posting a slight recovery, while oil continues to trend upward, as does the Dollar Index. The U.S. dollar strength index is also the only asset above 60 points on our “weather map,” which otherwise continues to signal weakness in bonds and a return to weakness in cryptocurrencies.
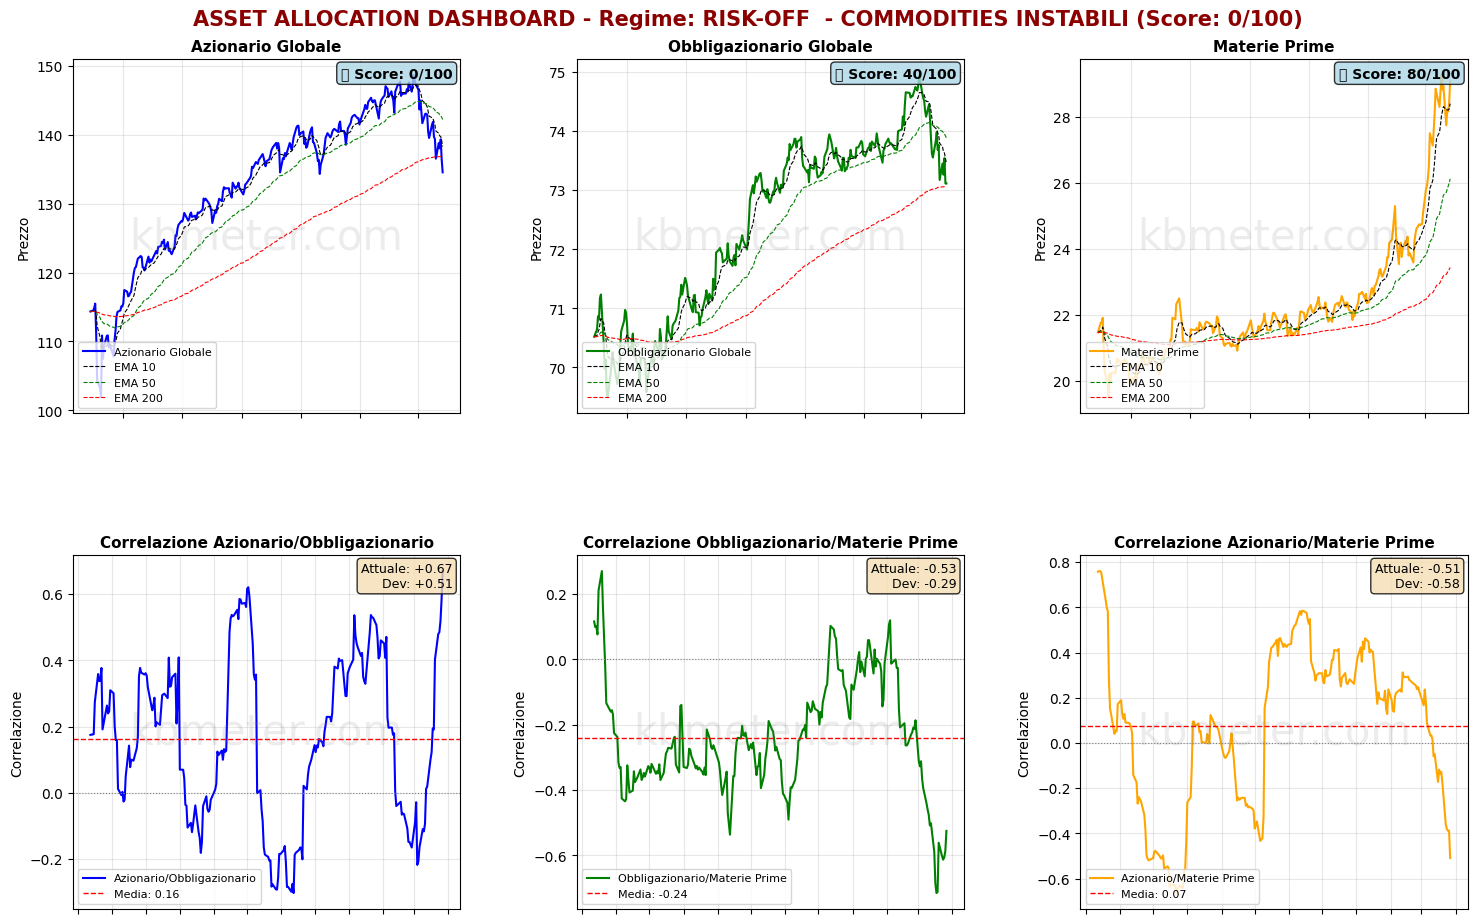
As for asset classes, we continue to monitor the long-term moving average areas for both equities and bonds. Global equities are currently below this important support zone, while bonds are just above it. The situation remains very delicate, and further negative news could seriously threaten the resilience of this support level. The correlation between equities and bonds is becoming increasingly positive.
Pre-Opening Futures: Global futures indicate a moderate risk-off sentiment (average -0.42%), with the U.S. slightly negative (-0.42%), Europe negative (-0.73%), and Asia positive (+0.53%).
📊 Global Futures – Pre-Opening Sentiment
- Nikkei 225 derived: +0.72%
- CSI 300: +0.65%
- Hang Seng derived: +0.23%
- TecDAX derived: -2.06%
- Dow Jones 30 cv1: -1.74%
- IBEX 35 derived: -1.23%
📄 Detailed Intermarket Analysis
INTERMARKET ANALYSIS - 2026-03-30
============================================================

MARKET HEALTH SCORE: 57.5/100
SENTIMENT: MODERATELY BULLISH

============================================================
SUMMARY OF MAIN RATIOS
============================================================


DJ/Gold:
  - Component score: 65.0/100
  - Current value: 10.0549
  - Position vs EMA50: ABOVE
  - 20-day ROC: +7.38%
  - 50-day ROC: -5.36%
  → Preference for risk assets vs safe haven

Gold/USD:
  - Component score: 35.0/100
  - Current value: 44.8527
  - Position vs EMA50: BELOW
  - 20-day ROC: -16.30%
  - 50-day ROC: -3.89%

Oil/Gold:
  - Component score: 80.0/100
  - Current value: 0.0222
  - Position vs EMA50: ABOVE
  - 20-day ROC: +73.11%
  - 50-day ROC: +65.46%
  - ⚠️ ANOMALY DETECTED - Significant deviation from the mean
  → Rising energy demand

SP500/VIX:
  - Component score: 5.0/100
  - Current value: 205.1160
  - Position vs EMA50: BELOW
  - 20-day ROC: -40.78%
  - 50-day ROC: -50.40%
  → Contracting risk appetite

Commodities/T30y:
  - Component score: 95.0/100
  - Current value: 0.3398
  - Position vs EMA50: ABOVE
  - 20-day ROC: +22.54%
  - 50-day ROC: +27.41%
  → Economic growth expectations

SP500/Nasdaq:
  - Component score: 95.0/100
  - Current value: 0.3040
  - Position vs EMA50: ABOVE
  - 20-day ROC: +0.19%
  - 50-day ROC: +3.02%

============================================================
CONCLUSIONS AND RECOMMENDATIONS
============================================================

The market is moderately constructive. Some ratios show positive signals,
but elements of caution remain. Monitor developments closely.
Positioning: SELECTIVE, favor quality.


STRONGEST RATIOS:
  • Commodities/T30y: 95.0/100
  • SP500/Nasdaq: 95.0/100
  • Oil/Gold: 80.0/100

WEAKEST RATIOS:
  • DJ/Gold: 65.0/100
  • Gold/USD: 35.0/100
  • SP500/VIX: 5.0/100

============================================================
Analysis automatically generated by kbmeter.com
Date: 2026-03-30
📄 Detailed Asset Allocation Analysis
ASSET ALLOCATION & REGIME ANALYSIS - 2026-03-30
======================================================================

MARKET REGIME: RISK-OFF - UNSTABLE COMMODITIES
REGIME SCORE: 0.0/100

======================================================================
TREND AND VOLATILITY ANALYSIS
======================================================================

GLOBAL EQUITIES (ACWI):
  Short-Term Trend (5d): -3.07% | BELOW EMA 10
  Medium-Term Trend (20d): -8.19% | BELOW EMA 50
  Long-Term Trend (60d): -4.90% | BELOW EMA 200

  Volatility 5d: 24.9%
  Volatility 20d: 18.9%
  Volatility 60d: 15.0%

COMMODITIES (DBC):
  Medium-Term Trend (20d): +12.75% | ABOVE EMA 50
  Volatility 20d: 29.4%

Correlation ACWI/BND (30d): 0.669

REGIME INTERPRETATION:
The market is in a risk-off regime. Negative trends across multiple time horizons
and/or elevated volatility. Flight to safe-haven assets.
Suggested positioning: DEFENSIVE, capital preservation.

⚠️ COMMODITIES ALERT: Commodities are showing high volatility. This may
indicate uncertainty about economic growth or unstable supply/demand dynamics.

======================================================================
ASSET RANKING - WHO IS PERFORMING BEST?
======================================================================

🥇 1. Commodities (DBC) - SCORE: 80/100
     Price: $29.10
     Trend: ABOVE EMA10 | ABOVE EMA50 | ABOVE EMA200
     Performance: 5d +4.86% | 20d +12.75% | 60d +30.14%
     Volatility: 5d 40.7% | 20d 29.4% | 60d 24.8%
     Drawdown: -0.58%
     → Asset in STRONG HEALTH: positive trends and controlled volatility

🥈 2. Global Bonds (BND) - SCORE: 40/100
     Price: $73.11
     Trend: BELOW EMA10 | BELOW EMA50 | ABOVE EMA200
     Performance: 5d -0.46% | 20d -2.05% | 60d -0.67%
     Volatility: 5d 6.6% | 20d 5.4% | 60d 4.0%
     Drawdown: -2.44%
     → Asset in WEAK conditions: negative trends or elevated volatility

🥉 3. Global Equities (ACWI) - SCORE: 0/100
     Price: $134.55
     Trend: BELOW EMA10 | BELOW EMA50 | BELOW EMA200
     Performance: 5d -3.07% | 20d -8.19% | 60d -4.90%
     Volatility: 5d 24.9% | 20d 18.9% | 60d 15.0%
     Drawdown: -9.49%
     → Asset in DISTRESS: avoid or heavily underweight

======================================================================
CORRELATION ANALYSIS - CURRENT vs HISTORICAL
======================================================================

ACWI/BND:
  Current correlation (30d): +0.669
  Historical average (1 year): +0.161
  Deviation: +0.508
  ⚠️ SIGNIFICANT DEVIATION from historical average
  → Positive correlation: diversification COMPROMISED

BND/DBC:
  Current correlation (30d): -0.526
  Historical average (1 year): -0.240
  Deviation: -0.285

ACWI/DBC:
  Current correlation (30d): -0.509
  Historical average (1 year): +0.074
  Deviation: -0.583
  ⚠️ SIGNIFICANT DEVIATION from historical average
  → Negative correlation: possible supply-driven shift

======================================================================
OPERATIONAL SUMMARY
======================================================================

STRONGEST ASSET: Commodities (Score: 80/100)
WEAKEST ASSET: Global Equities (Score: 0/100)

SUGGESTED ACTION: Reduce exposure to the weakest asset, favor defensive positioning.
DIVERSIFICATION: GOOD - Diversification benefits present.

======================================================================
Analysis automatically generated by kbmeter.com
Date: 2026-03-30
On the macro front, the day features important data from the Eurozone. First and foremost is the preliminary estimate of Germany’s March 2026 inflation—forecasts point to a sharp acceleration. Also noteworthy are the figures on private sector confidence in the region.
Already a subscriber? Login here
NOTES AND WARNINGS
Data compiled by kbmeter.com. Analysis date: 30 March 2026 - 7:29 AM GMT+1
This content is provided for informational purposes only and should not be considered financial advice. All scores and assessments are based on the previous trading day’s closing prices. Futures indications refer to the date and time of the analysis.