Financial Markets Unimpressed by Trump’s Speech, Await Nvidia Earnings
Financial markets do not seem to be moving much following Trump’s address to Congress, and investors are preparing for an important day on the earnings front. Today, in fact, Nvidia will release its figures, a bellwether company for the health of the U.S. tech sector, which has been shaken in recent days by concerns over AI. Sentiment remains neutral and volatility continues to be elevated, with assets such as gold and oil maintaining a certain strength. Futures indicate a largely stable opening for the United States and a slightly positive one for Europe.
Market Weather Map
February 25, 2026
US Equities
Eu Equities
Asia Equities
Commodities
Bonds
Dollar Index
Technology
Gold
Oil
Crypto
Market Summary
How to interpret our financial indicators? Find out here.
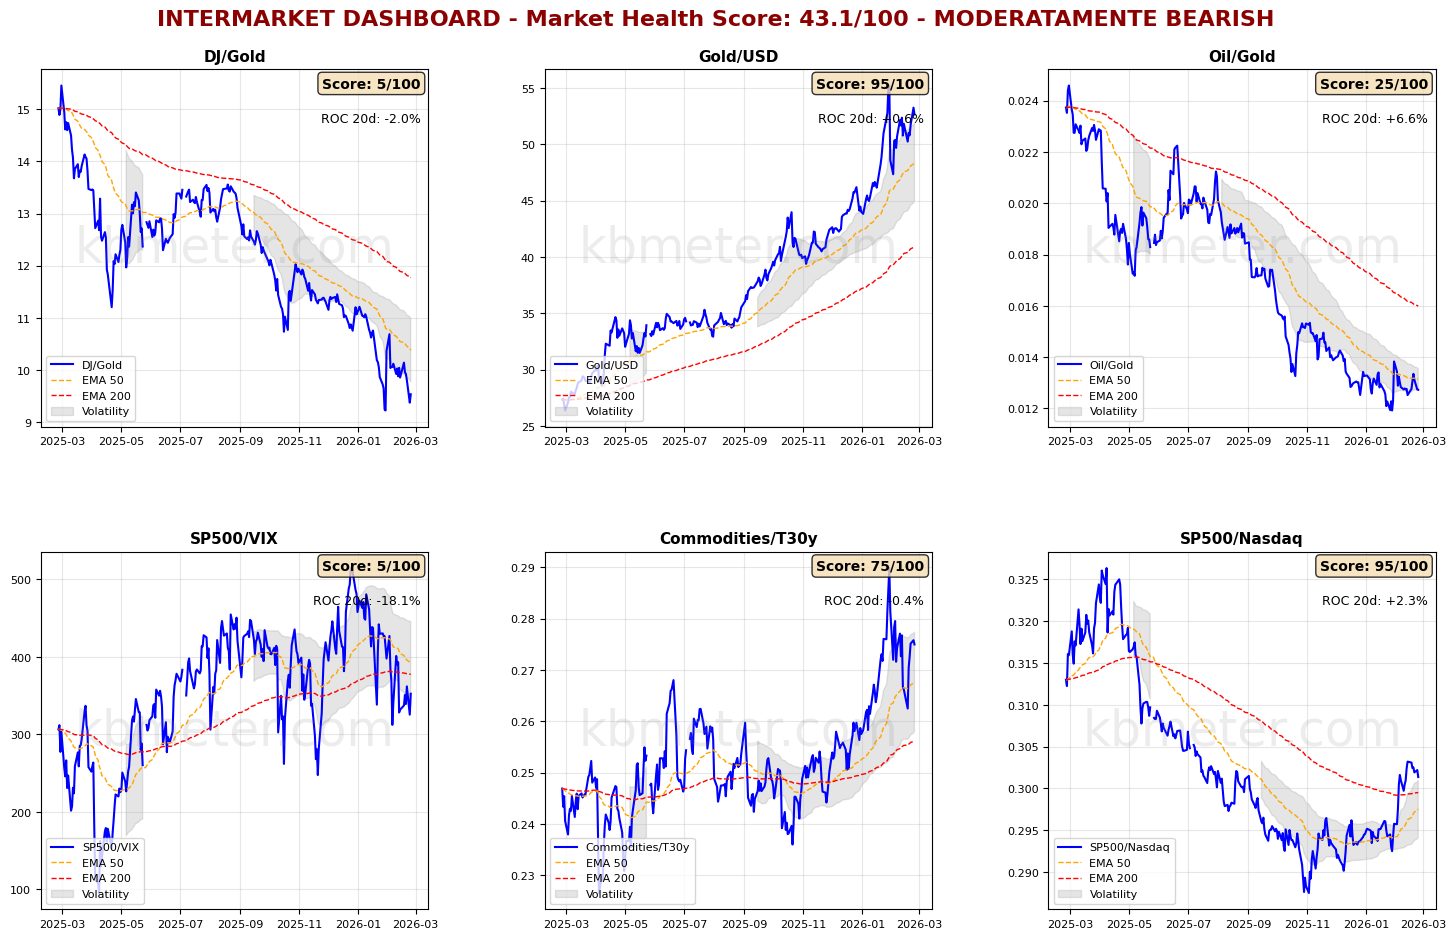
Financial markets today show a neutral to slightly positive sentiment. Intermarket analysis highlights a Market Health Score of 43/100 (moderately negative). Market conditions remain uncertain, and our intermarket dashboards continue to indicate neutral sentiment and high volatility. This is a short-term situation with no clear direction, but at the same time it continues not to affect the medium- to long-term trends, which remain set to the upside for both global equities and global bonds.
Pre-Opening Futures: Global futures signal a moderate risk-on sentiment (+0.21% on average), with the U.S. slightly positive (+0.02%), Europe slightly positive (+0.15%), and Asia positive (+0.63%).
📊 Global Futures – Pre-Opening Sentiment
- Nikkei 225 derived: +1.20%
- CSI 300: +1.06%
- TecDAX derived: +0.92%
- Hang Seng derived: -0.36%
- IBEX 35 derived: -0.22%
- FTSE MIB derived: -0.10%
📄 Detailed Intermarket Analysis
INTERMARKET ANALYSIS - 2026-02-25
============================================================

MARKET HEALTH SCORE: 43.1/100
SENTIMENT: MODERATELY BEARISH

============================================================
MAIN RATIOS SUMMARY
============================================================


DJ/Gold:
  - Component score: 5.0/100
  - Current value: 9.5377
  - Position vs EMA50: BELOW
  - 20-day ROC: -1.95%
  - 50-day ROC: -16.72%
  → Flight to safe havens

Gold/USD:
  - Component score: 95.0/100
  - Current value: 52.6747
  - Position vs EMA50: ABOVE
  - 20-day ROC: +0.63%
  - 50-day ROC: +24.00%

Oil/Gold:
  - Component score: 25.0/100
  - Current value: 0.0127
  - Position vs EMA50: BELOW
  - 20-day ROC: +6.65%
  - 50-day ROC: -8.63%
  → Rising energy demand

SP500/VIX:
  - Component score: 5.0/100
  - Current value: 352.4333
  - Position vs EMA50: BELOW
  - 20-day ROC: -18.11%
  - 50-day ROC: -19.30%
  → Contracting risk appetite

Commodities/T30y:
  - Component score: 75.0/100
  - Current value: 0.2750
  - Position vs EMA50: ABOVE
  - 20-day ROC: -0.37%
  - 50-day ROC: +7.68%
  → Economic growth expectations

SP500/Nasdaq:
  - Component score: 95.0/100
  - Current value: 0.3014
  - Position vs EMA50: ABOVE
  - 20-day ROC: +2.33%
  - 50-day ROC: +3.51%

============================================================
CONCLUSIONS AND RECOMMENDATIONS
============================================================

The market shows signs of weakness. Several ratios are in negative territory.
Risk appetite declining. Increase caution.
Positioning: DEFENSIVE, favor safe havens.


STRONGEST RATIOS:
  • Gold/USD: 95.0/100
  • SP500/Nasdaq: 95.0/100
  • Commodities/T30y: 75.0/100

WEAKEST RATIOS:
  • Oil/Gold: 25.0/100
  • DJ/Gold: 5.0/100
  • SP500/VIX: 5.0/100

============================================================
Analysis automatically generated by kbmeter.com
Date: 2026-02-25
📄 Detailed Asset Allocation Analysis
ASSET ALLOCATION & REGIME ANALYSIS - 2026-02-25
======================================================================
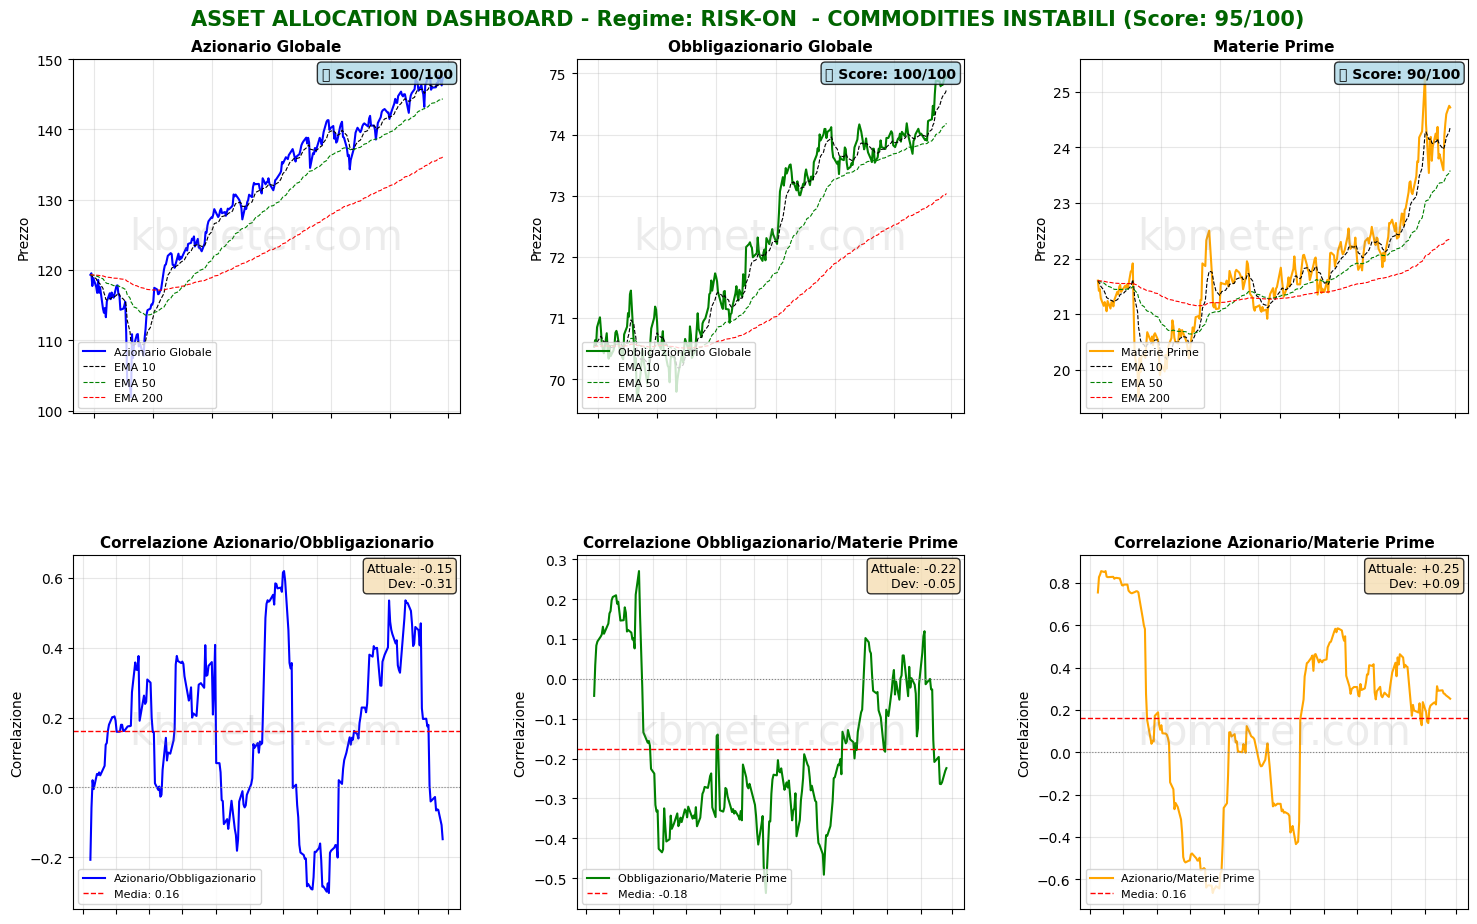
MARKET REGIME: RISK-ON - UNSTABLE COMMODITIES
REGIME SCORE: 95.0/100
======================================================================
TREND AND VOLATILITY ANALYSIS
======================================================================
GLOBAL EQUITIES (ACWI):
Short Trend (5d): +0.48% | ABOVE EMA 10
Medium Trend (20d): +0.18% | ABOVE EMA 50
Long Trend (60d): +5.58% | ABOVE EMA 200
Volatility 5d: 11.9%
Volatility 20d: 13.3%
Volatility 60d: 10.8%
COMMODITIES (DBC):
Medium Trend (20d): +0.41% | ABOVE EMA 50
Volatility 20d: 28.0%
ACWI/BND Correlation (30d): -0.148
REGIME INTERPRETATION:
The market is in a risk-on regime. Equities show positive trends across multiple
time horizons and volatility remains contained. Investors favor risk assets.
Suggested positioning: OVERWEIGHT equities.
⚠️ COMMODITIES ALERT: Commodities are showing elevated volatility. This may
indicate uncertainty about economic growth or unstable supply/demand dynamics.
======================================================================
ASSET RANKING - TOP PERFORMERS
======================================================================
🥇 1. Global Equities (ACWI) - SCORE: 100/100
Price: $147.33
Trend: ABOVE EMA10 | ABOVE EMA50 | ABOVE EMA200
Performance: 5d +0.48% | 20d +0.18% | 60d +5.58%
Volatility: 5d 11.9% | 20d 13.3% | 60d 10.8%
Drawdown: -0.26%
→ Asset in STRONG HEALTH: positive trends and controlled volatility
🥈 2. Global Bonds (BND) - SCORE: 100/100
Price: $74.93
Trend: ABOVE EMA10 | ABOVE EMA50 | ABOVE EMA200
Performance: 5d +0.19% | 20d +1.21% | 60d +1.03%
Volatility: 5d 2.0% | 20d 2.9% | 60d 2.9%
Drawdown: -0.05%
→ Asset in STRONG HEALTH: positive trends and controlled volatility
🥉 3. Commodities (DBC) - SCORE: 90/100
Price: $24.72
Trend: ABOVE EMA10 | ABOVE EMA50 | ABOVE EMA200
Performance: 5d +2.11% | 20d +0.41% | 60d +12.27%
Volatility: 5d 16.2% | 20d 28.0% | 60d 19.4%
Drawdown: -2.29%
→ Asset in STRONG HEALTH: positive trends and controlled volatility
======================================================================
CORRELATION ANALYSIS - CURRENT vs HISTORICAL
======================================================================
ACWI/BND:
Current correlation (30d): -0.148
Historical average (1 year): +0.161
Deviation: -0.309
⚠️ SIGNIFICANT DEVIATION from historical average
→ Weak correlation: moderate diversification
BND/DBC:
Current correlation (30d): -0.224
Historical average (1 year): -0.177
Deviation: -0.047
ACWI/DBC:
Current correlation (30d): +0.253
Historical average (1 year): +0.164
Deviation: +0.089
======================================================================
OPERATIONAL SUMMARY
======================================================================
STRONGEST ASSET: Global Equities (Score: 100/100)
WEAKEST ASSET: Commodities (Score: 90/100)
SUGGESTED ACTION: Favor the strongest asset, maintain risk exposure.
DIVERSIFICATION: EXCELLENT - Asset classes are moving independently.
======================================================================
Analysis automatically generated by kbmeter.com
Date: 2026-02-25
On the macroeconomic front, the day offers very few highlights. Worth noting are the final January inflation data in the Eurozone and German consumer confidence.
It is, however, a crucial day on the earnings front. Markets are awaiting Nvidia’s results, but attention should also be paid to the earnings reports from Salesforce and Snowflake.
Already a subscriber? Login here
NOTES AND WARNINGS
Analysis automatically generated by kbmeter.com. Analysis date: 25 February 2026 - 7:36 AM GMT+1
This content is provided for informational purposes only and should not be considered financial advice. All scores and assessments are based on the previous trading day’s closing prices. Futures indications refer to the date and time of the analysis.