Financial Markets Frozen by Trump’s Remarks, Week Ends Once Again Under the Sign of Oil
Nothing to report. The anticipated address by Trump to the nation failed to provide any additional momentum to the attempted recovery of financial markets. The war in Iran continues and—barring further reversals—appears to be entering a phase of intensified U.S. attacks.
The weak rally seen yesterday in the markets is already a thing of the past, with oil accelerating again and investor sentiment remaining between moderately negative and neutral. Volatility remains high, and among the most interesting movements—and those to be closely monitored—are the rebound in gold and the bounce in bonds, signals that could tell us a great deal about investor expectations regarding the impact of the conflict on the global economy. Futures indicate a negative start for the final trading session of the week, both in Europe and the United States.
Market Weather Map
April 2, 2026
US Equities
Eu Equities
Asia Equities
Commodities
Bonds
Dollar Index
Technology
Gold
Oil
Crypto
Market Summary
How to interpret our financial indicators? Find out here.
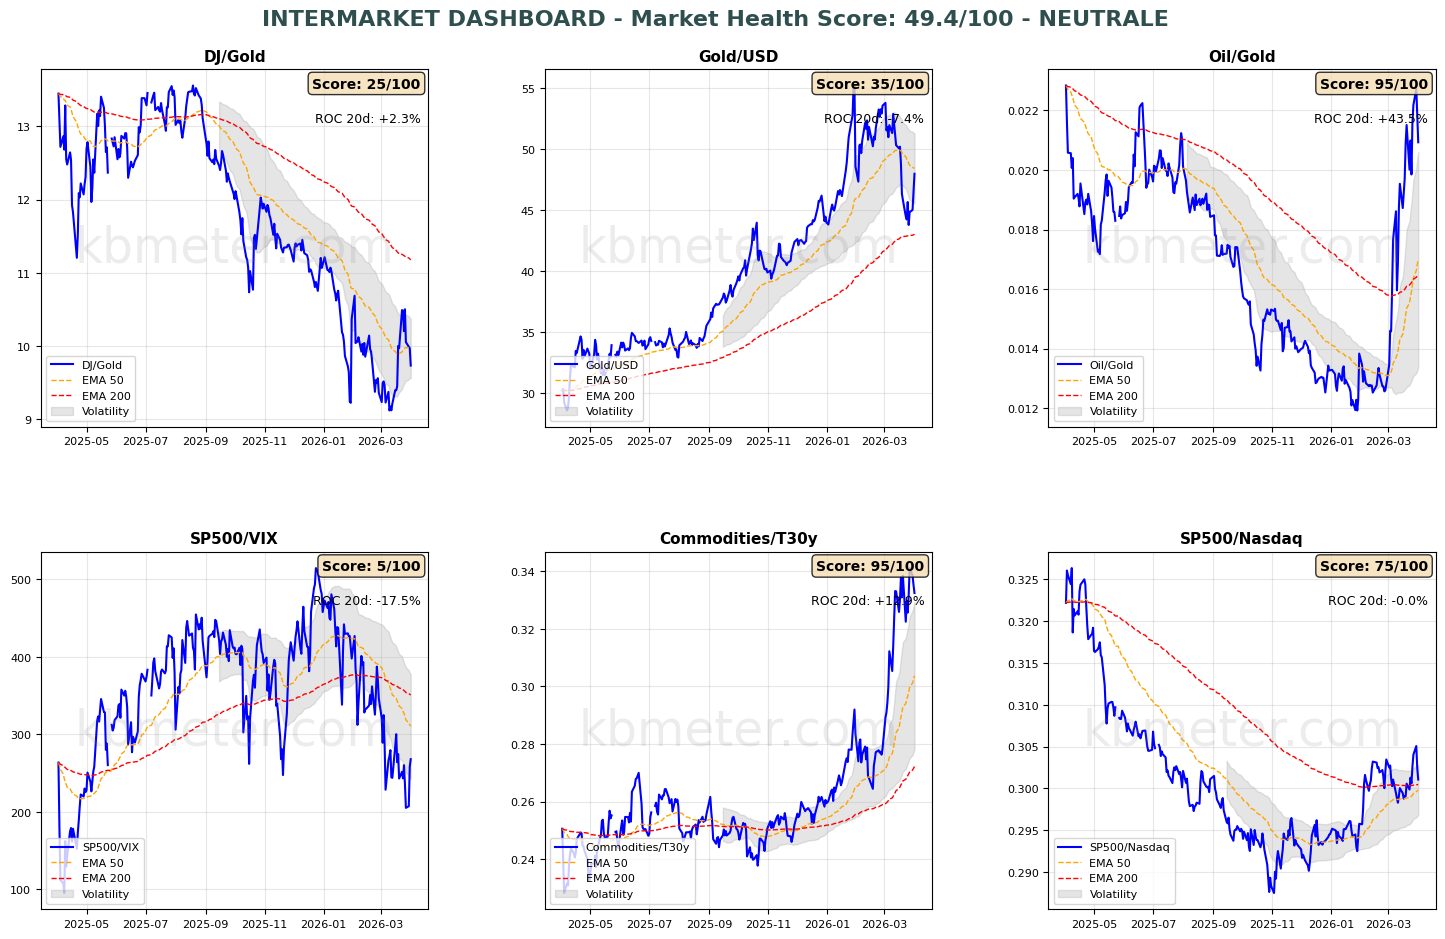
Financial markets today show a neutral sentiment. Intermarket analysis highlights a Market Health Score of 49/100 (neutral).
Today we begin with the market “weather map.” As can be seen, the only asset above 55 points and showing a positive trend is oil. This is no coincidence and is perhaps the clearest snapshot of the challenging weeks we are experiencing. Our intermarket dashboards continue to point to a situation of persistent uncertainty, so to speak. Risk appetite indicators remain weak, and oil continues to show strength. The only new development is the rebound in gold, which should be assessed over the coming sessions for the potential signals it may provide about investor sentiment.
As for asset classes, the analysis remains unchanged. For now, the support zone around the long-term moving average is holding and will likely be tested again between today and next Monday (when markets will also have to digest labor market data).
Watch closely the rebound in bonds and their correlation with equities—these will be key data points to monitor in the coming days.
Pre-market futures: Global futures point to a risk-off sentiment (average -0.61%), with the U.S. sharply negative (-1.42%), Europe slightly negative (-0.13%), and Asia negative (-0.98%).
📊 Global Futures – Pre-Market Sentiment
- FTSE MIB derived: +3.22%
- IBEX 35 derived: +2.24%
- TecDAX derived: +2.23%
- Nikkei 225 derived: -3.05%
- Euro Stoxx 50 derived: -1.94%
- DAX derived: -1.88%
📄 Detailed Intermarket Analysis
INTERMARKET ANALYSIS - 2026-04-02
============================================================

MARKET HEALTH SCORE: 49.4/100
SENTIMENT: NEUTRAL

============================================================
MAIN RATIOS SUMMARY
============================================================


DJ/Gold:
  - Component score: 25.0/100
  - Current value: 9.7353
  - Position vs EMA50: BELOW
  - 20-day ROC: +2.27%
  - 50-day ROC: -4.44%
  → Flight to safe havens

Gold/USD:
  - Component score: 35.0/100
  - Current value: 48.0000
  - Position vs EMA50: BELOW
  - 20-day ROC: -7.41%
  - 50-day ROC: -0.52%

Oil/Gold:
  - Component score: 95.0/100
  - Current value: 0.0209
  - Position vs EMA50: ABOVE
  - 20-day ROC: +43.55%
  - 50-day ROC: +65.11%
  → Rising energy demand

SP500/VIX:
  - Component score: 5.0/100
  - Current value: 267.9429
  - Position vs EMA50: BELOW
  - 20-day ROC: -17.51%
  - 50-day ROC: -20.80%
  → Contracting risk appetite

Commodities/T30y:
  - Component score: 95.0/100
  - Current value: 0.3325
  - Position vs EMA50: ABOVE
  - 20-day ROC: +12.94%
  - 50-day ROC: +21.34%
  → Economic growth expectations

SP500/Nasdaq:
  - Component score: 75.0/100
  - Current value: 0.3011
  - Position vs EMA50: ABOVE
  - 20-day ROC: -0.05%
  - 50-day ROC: +1.67%

============================================================
CONCLUSIONS AND RECOMMENDATIONS
============================================================

The market is in a neutral/sideways phase. Mixed signals across the various ratios.
There is no clear directional bias. Wait for confirmation.
Positioning: BALANCED, avoid excess exposure.


STRONGEST RATIOS:
  • Oil/Gold: 95.0/100
  • Commodities/T30y: 95.0/100
  • SP500/Nasdaq: 75.0/100

WEAKEST RATIOS:
  • Gold/USD: 35.0/100
  • DJ/Gold: 25.0/100
  • SP500/VIX: 5.0/100

============================================================
Analysis automatically generated by kbmeter.com
Date: 2026-04-02
📄 Detailed Asset Allocation Analysis
ASSET ALLOCATION & REGIME ANALYSIS - 2026-04-02
======================================================================
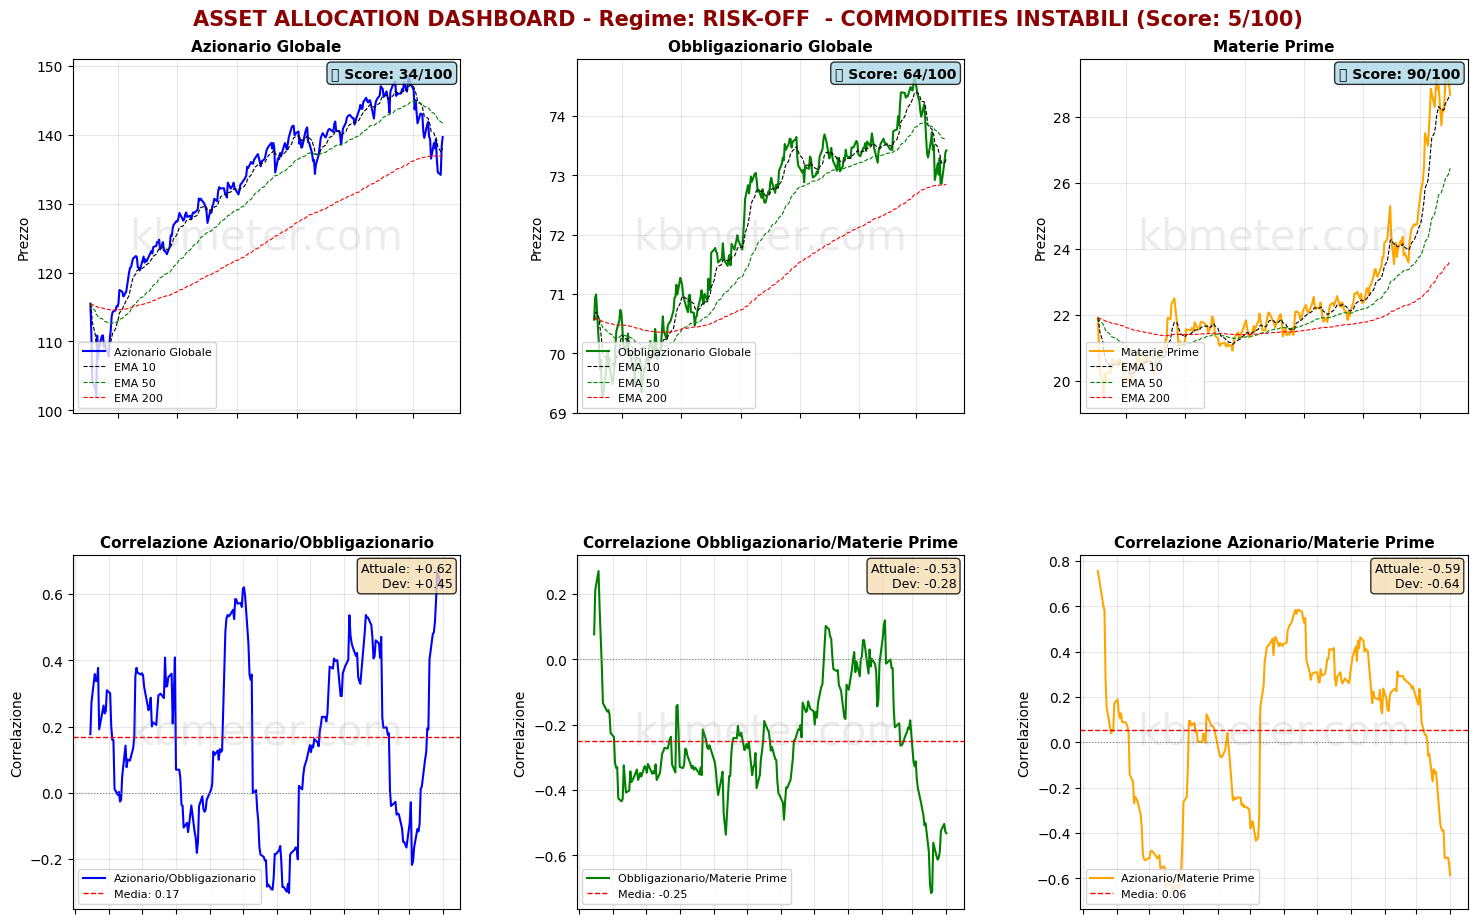
MARKET REGIME: RISK-OFF - UNSTABLE COMMODITIES
REGIME SCORE: 5.0/100
======================================================================
TREND AND VOLATILITY ANALYSIS
======================================================================
GLOBAL EQUITIES (ACWI):
Short-Term Trend (5d): +2.41% | ABOVE EMA 10
Medium-Term Trend (20d): -2.55% | BELOW EMA 50
Long-Term Trend (60d): -3.24% | ABOVE EMA 200
Volatility 5d: 32.7%
Volatility 20d: 21.8%
Volatility 60d: 16.3%
COMMODITIES (DBC):
Medium-Term Trend (20d): +8.14% | ABOVE EMA 50
Volatility 20d: 29.4%
Correlation ACWI/BND (30d): 0.622
REGIME INTERPRETATION:
The market is in a risk-off regime. Negative trends across multiple horizons and/or
elevated volatility. Flight to safe-haven assets.
Suggested positioning: DEFENSIVE, capital preservation.
⚠️ COMMODITIES ALERT: Commodities are showing elevated volatility. This may
indicate uncertainty about economic growth or unstable supply/demand dynamics.
======================================================================
ASSET RANKING - RELATIVE STRENGTH
======================================================================
🥇 1. Commodities (DBC) - SCORE: 90/100
Price: $28.68
Trend: ABOVE EMA10 | ABOVE EMA50 | ABOVE EMA200
Performance: 5d +0.84% | 20d +8.14% | 60d +25.79%
Volatility: 5d 22.3% | 20d 29.4% | 60d 24.7%
Drawdown: -2.02%
→ Asset in STRONG CONDITION: positive trends and controlled volatility
🥈 2. Global Bonds (BND) - SCORE: 64/100
Price: $73.42
Trend: ABOVE EMA10 | BELOW EMA50 | ABOVE EMA200
Performance: 5d +0.77% | 20d -0.90% | 60d -0.06%
Volatility: 5d 6.4% | 20d 5.8% | 60d 4.1%
Drawdown: -1.70%
→ Asset in FAIR CONDITION: mostly positive signals
🥉 3. Global Equities (ACWI) - SCORE: 34/100
Price: $139.67
Trend: ABOVE EMA10 | BELOW EMA50 | ABOVE EMA200
Performance: 5d +2.41% | 20d -2.55% | 60d -3.24%
Volatility: 5d 32.7% | 20d 21.8% | 60d 16.3%
Drawdown: -6.04%
→ Asset in WEAK CONDITION: negative trends or elevated volatility
======================================================================
CORRELATION ANALYSIS - CURRENT vs HISTORICAL
======================================================================
ACWI/BND:
Current correlation (30d): +0.622
Historical average (1 year): +0.167
Deviation: +0.455
⚠️ SIGNIFICANT DEVIATION from historical average
→ Positive correlation: diversification COMPROMISED
BND/DBC:
Current correlation (30d): -0.533
Historical average (1 year): -0.249
Deviation: -0.284
ACWI/DBC:
Current correlation (30d): -0.586
Historical average (1 year): +0.056
Deviation: -0.643
⚠️ SIGNIFICANT DEVIATION from historical average
→ Negative correlation: possible supply-driven shift
======================================================================
OPERATIONAL SUMMARY
======================================================================
STRONGEST ASSET: Commodities (Score: 90/100)
WEAKEST ASSET: Global Equities (Score: 34/100)
SUGGESTED ACTION: Reduce exposure to the weakest asset, favor defensive positioning.
DIVERSIFICATION: GOOD - diversification benefits still present.
======================================================================
Analysis automatically generated by kbmeter.com
Date: 2026-04-02
On the macro front, the day offers few but meaningful data points. From the United States, we will receive figures on unemployment claims, February export and import data, and the March 2026 report on announced job cuts.
Already a subscriber? Login here
NOTES AND WARNINGS
Analysis automatically generated by kbmeter.com. Analysis date: 2 April 2026 - 8:04 AM GMT+1
This content is provided for informational purposes only and should not be considered financial advice. All scores and assessments are based on the previous trading day’s closing prices. Futures indications refer to the date and time of the analysis.