Financial Markets: Tech Earnings Support Risk-On Mood; Inflation Expectations Weigh on Bonds
Financial markets are leaning on the technology sector to maintain their risk-on stance, while the stalemate in the Middle East risks becoming prolonged. Strong earnings from the semiconductor sector are also supporting emerging equities, which are rising alongside the US and leaving European markets behind. The Dow/Gold ratio is approaching resistance at its long-term moving average, while inflation expectations are weighing on bonds. Futures indicate a positive start for both Europe and the United States.
Market Weather Map
May 6, 2026
US Equities
Eu Equities
Asia Equities
Commodities
Bonds
Dollar Index
Technology
Gold
Oil
Crypto
Market Summary
Financial markets sentiment
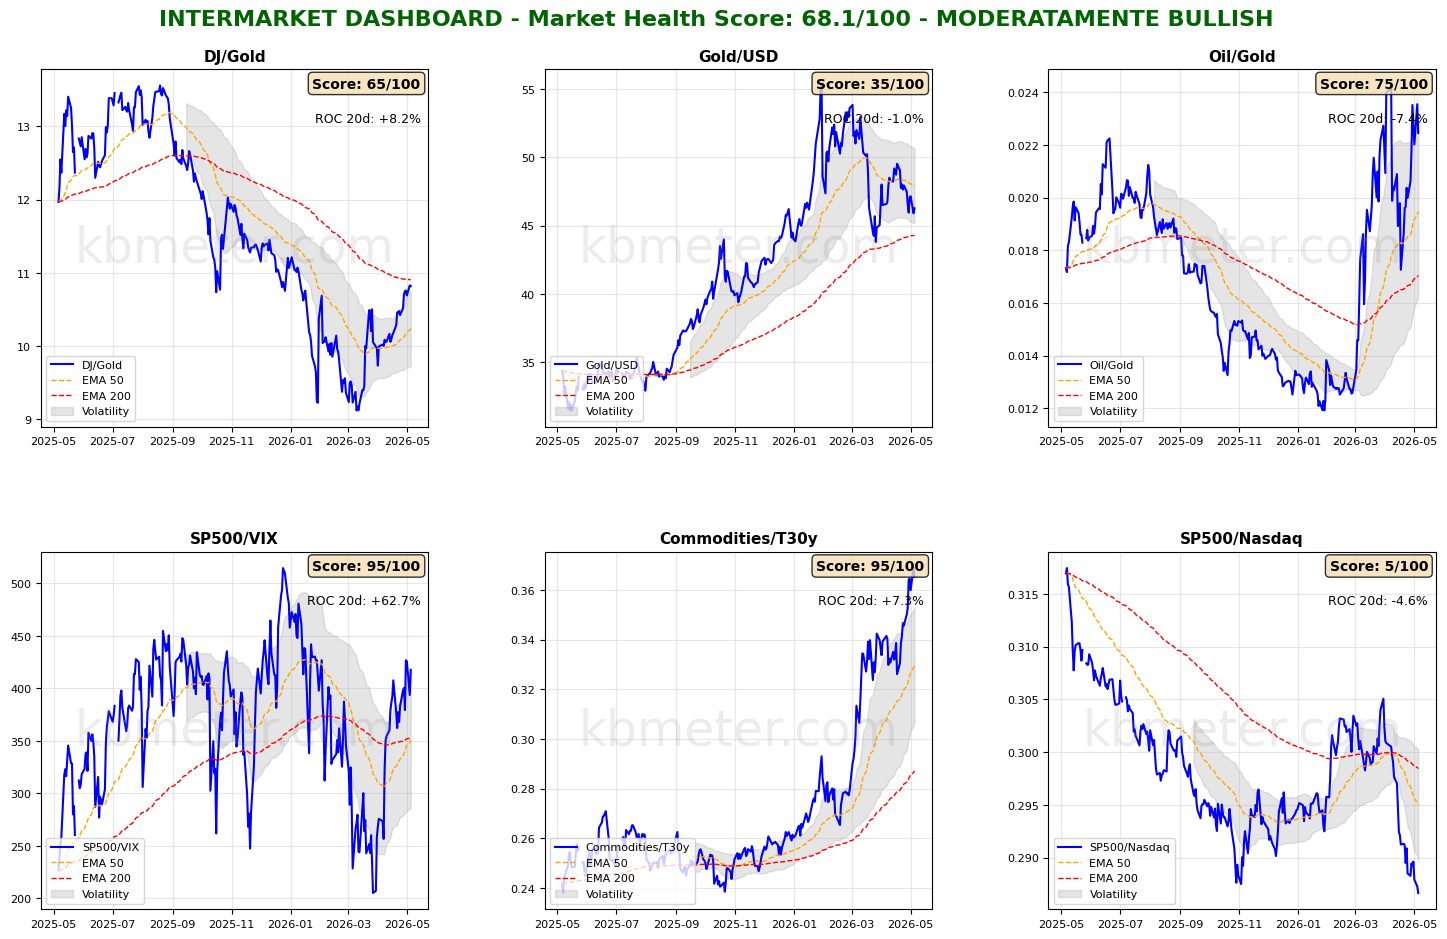
Financial markets are showing a moderately positive sentiment today. Intermarket analysis highlights a Market Health Score of 68/100 (positive). Looking at our intermarket dashboards, three key considerations stand out: the Dow/Gold ratio is nearing resistance at its long-term moving average; the strengthening of the technology sector continues, while the S&P 500/VIX ratio remains stable; oil continues to be relatively strong compared to gold, and inflation expectations remain elevated.
In summary, this reflects a moderately risk-on environment, where the technology sector is driving the rebound in equities, while bonds are pressured by inflation expectations and higher interest rates. This appears to be the signal markets are currently sending.
The analysis of asset classes confirms this view, with equities remaining upward-oriented, while bonds are trading below the 50-day moving average.
Our “weather map” confirms the picture: technology and oil remain above 60 points in the health score, while geographically, European equities are weaker than those in the US and emerging markets. The latter are benefiting from strong tech data, while the Old Continent is suffering from the energy crisis.
Global Futures – Pre-Market Sentiment
Pre-market futures: Global futures signal a risk-on sentiment (average +0.90%), with the US slightly positive (+0.36%), Europe strongly positive (+1.29%), and Asia slightly positive (+0.45%).
📊 Global Futures – Pre-Market Sentiment
- TecDAX derived: +3.54%
- IBEX 35 derived: +2.33%
- FTSE MIB derived: +2.28%
- CSI 300: -0.02%
- Mini MDAX derived: +0.00%
- Russell 2000: +0.16%
Intermarket details
📄 Detailed Intermarket Analysis
INTERMARKET ANALYSIS - 2026-05-06
============================================================

MARKET HEALTH SCORE: 68.1/100
SENTIMENT: MODERATELY BULLISH

============================================================
SUMMARY OF KEY RATIOS
============================================================


DJ/Gold:
  - Component score: 65.0/100
  - Current value: 10.8210
  - Position vs EMA50: ABOVE
  - 20-day ROC: +8.18%
  - 50-day ROC: +15.40%
  → Preference for risk assets vs safe haven

Gold/USD:
  - Component score: 35.0/100
  - Current value: 46.2612
  - Position vs EMA50: BELOW
  - 20-day ROC: -1.02%
  - 50-day ROC: -13.16%

Oil/Gold:
  - Component score: 75.0/100
  - Current value: 0.0224
  - Position vs EMA50: ABOVE
  - 20-day ROC: -7.44%
  - 50-day ROC: +76.20%
  → Weakening energy demand

SP500/VIX:
  - Component score: 95.0/100
  - Current value: 417.6767
  - Position vs EMA50: ABOVE
  - 20-day ROC: +62.73%
  - 50-day ROC: +28.34%
  → Expanding risk appetite

Commodities/T30y:
  - Component score: 95.0/100
  - Current value: 0.3652
  - Position vs EMA50: ABOVE
  - 20-day ROC: +7.34%
  - 50-day ROC: +30.97%
  → Economic growth expectations

SP500/Nasdaq:
  - Component score: 5.0/100
  - Current value: 0.2866
  - Position vs EMA50: BELOW
  - 20-day ROC: -4.62%
  - 50-day ROC: -5.15%

============================================================
CONCLUSIONS AND RECOMMENDATIONS
============================================================

The market is moderately constructive. Some ratios show positive signals
but elements of caution remain. Monitor developments closely.
Positioning: SELECTIVE, favor quality.


STRONGEST RATIOS:
  • SP500/VIX: 95.0/100
  • Commodities/T30y: 95.0/100
  • Oil/Gold: 75.0/100

WEAKEST RATIOS:
  • DJ/Gold: 65.0/100
  • Gold/USD: 35.0/100
  • SP500/Nasdaq: 5.0/100

============================================================
Analysis automatically generated by kbmeter.com
Date: 2026-05-06
📄 Detailed Asset Allocation Analysis
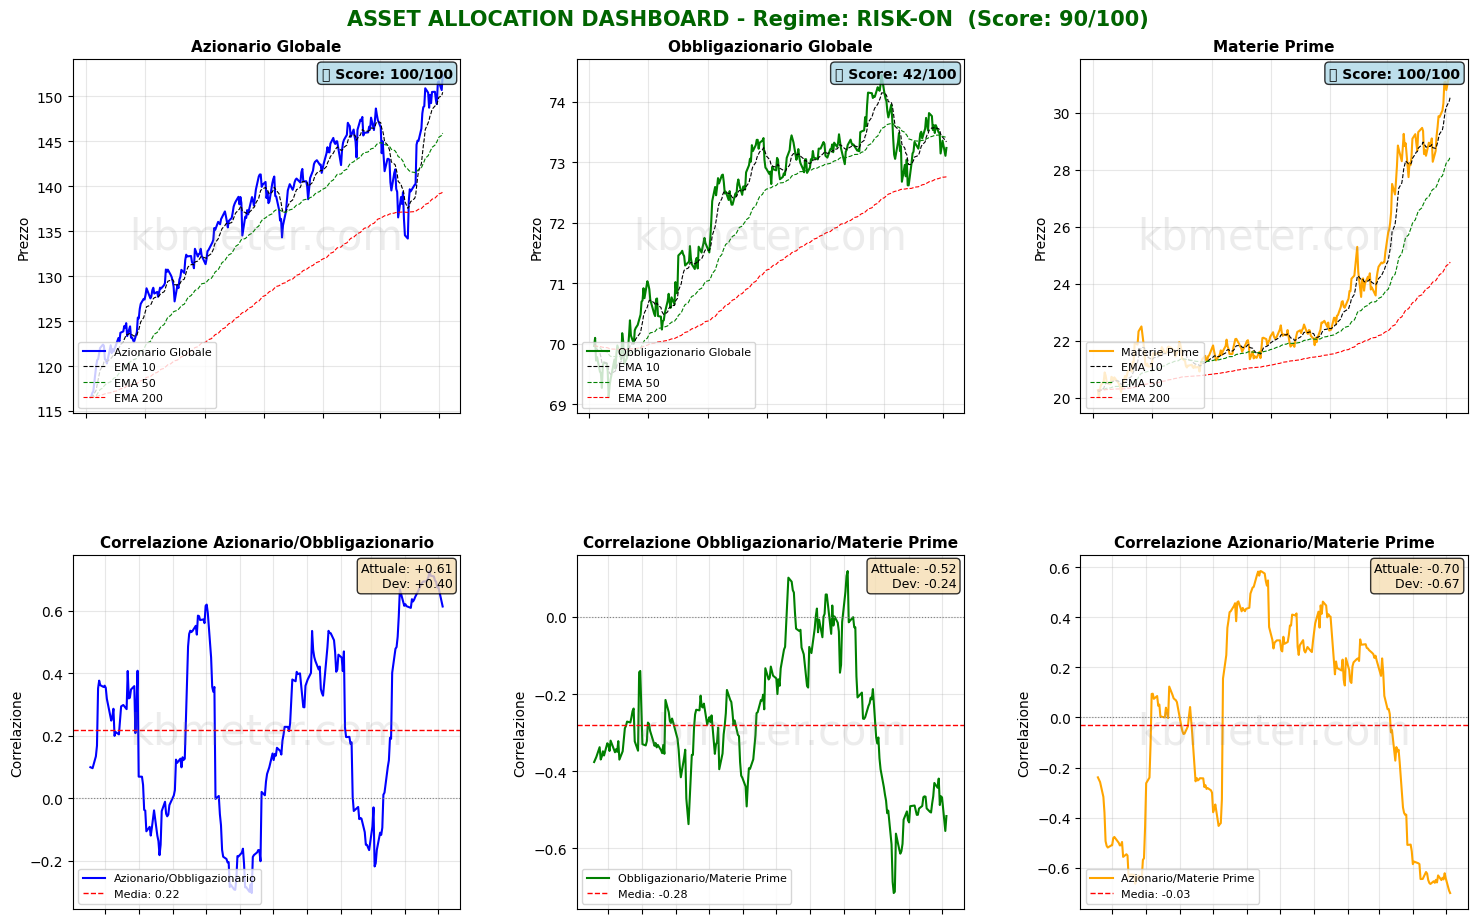
ASSET ALLOCATION & REGIME ANALYSIS - 2026-05-06
======================================================================

MARKET REGIME: RISK-ON
REGIME SCORE: 90.0/100

======================================================================
TREND AND VOLATILITY ANALYSIS
======================================================================

GLOBAL EQUITIES (ACWI):
  Short-Term Trend (5d): +2.15% | ABOVE EMA 10
  Medium-Term Trend (20d): +5.35% | ABOVE EMA 50
  Long-Term Trend (60d): +3.35% | ABOVE EMA 200

  Volatility 5d: 15.1%
  Volatility 20d: 15.8%
  Volatility 60d: 17.3%

COMMODITIES (DBC):
  Medium-Term Trend (20d): +9.24% | ABOVE EMA 50
  Volatility 20d: 22.2%

ACWI/BND Correlation (30d): 0.614

REGIME INTERPRETATION:
The market is in a risk-on regime. Equities show positive trends across multiple
time horizons and volatility remains contained. Investors favor risk assets.
Suggested positioning: OVERWEIGHT equities.

======================================================================
ASSET RANKING - WHO IS PERFORMING BEST?
======================================================================

🥇 1. Global Equities (ACWI) - SCORE: 100/100
     Price: $152.35
     Trend: ABOVE EMA10 | ABOVE EMA50 | ABOVE EMA200
     Performance: 5d +2.15% | 20d +5.35% | 60d +3.35%
     Volatility: 5d 15.1% | 20d 15.8% | 60d 17.3%
     Drawdown: 0.00%
     → Asset in STRONG HEALTH: positive trends and controlled volatility

🥈 2. Commodities (DBC) - SCORE: 100/100
     Price: $31.20
     Trend: ABOVE EMA10 | ABOVE EMA50 | ABOVE EMA200
     Performance: 5d +0.39% | 20d +9.24% | 60d +28.66%
     Volatility: 5d 22.8% | 20d 22.2% | 60d 23.7%
     Drawdown: -0.41%
     → Asset in STRONG HEALTH: positive trends and controlled volatility

🥉 3. Global Bonds (BND) - SCORE: 42/100
     Price: $73.24
     Trend: BELOW EMA10 | BELOW EMA50 | ABOVE EMA200
     Performance: 5d +0.13% | 20d -0.32% | 60d -0.40%
     Volatility: 5d 4.8% | 20d 3.6% | 60d 4.3%
     Drawdown: -1.61%
     → Asset in WEAK conditions: negative trends or elevated volatility

======================================================================
CORRELATION ANALYSIS - CURRENT vs HISTORICAL
======================================================================

ACWI/BND:
  Current correlation (30d): +0.614
  Historical average (1 year): +0.218
  Deviation: +0.396
  ⚠️ SIGNIFICANT DEVIATION from historical average
  → Positive correlation: diversification COMPROMISED

BND/DBC:
  Current correlation (30d): -0.516
  Historical average (1 year): -0.279
  Deviation: -0.237

ACWI/DBC:
  Current correlation (30d): -0.702
  Historical average (1 year): -0.030
  Deviation: -0.671
  ⚠️ SIGNIFICANT DEVIATION from historical average
  → Negative correlation: possible supply-driven shift

======================================================================
OPERATIONAL SUMMARY
======================================================================

STRONGEST ASSET: Global Equities (Score: 100/100)
WEAKEST ASSET: Global Bonds (Score: 42/100)

SUGGESTED ACTION: Favor the strongest asset, maintain risk exposure.
DIVERSIFICATION: POOR - Asset classes tend to move together.

======================================================================
Analysis automatically generated by kbmeter.com
Date: 2026-05-06
Macroeconomic Calendar
Today’s macroeconomic calendar offers few but interesting data points: trends in China’s services sector, the US ADP employment report for April, and Eurozone producer prices for March 2026.
On the earnings front, attention today is focused on Novo Nordisk, Uber, and The Walt Disney Company.
Already a subscriber? Login here
NOTES AND WARNINGS
Data compiled by kbmeter.com. Analysis date: 6 May 2026 - 7:42 AM GMT+1
This content is provided for informational purposes only and should not be considered financial advice. All scores and assessments are based on the previous trading day’s closing prices. Futures indications refer to the date and time of the analysis.