Financial Markets Still Lack Clear Catalysts, Sentiment Neutral; Focus on Fed Minutes and UK Inflation
Financial markets continue this week without a clear direction, with volatility remaining elevated and sentiment staying in neutral territory. While waiting for the U.S. PCE inflation data (Friday), investors are closely watching the Fed minutes. The trend in UK inflation will also be carefully monitored to understand the evolution of the ECB’s monetary policy, given the weakness in the labor market. Futures point to a positive opening for Europe and the United States, while the positive momentum in global bonds continues. Gold is in a stabilization phase.
Market Weather Map
February 18, 2026
US Equities
Eu Equities
Asia Equities
Commodities
Bonds
Dollar Index
Technology
Gold
Oil
Crypto
Market Summary
How to interpret our financial indicators? Find out here.
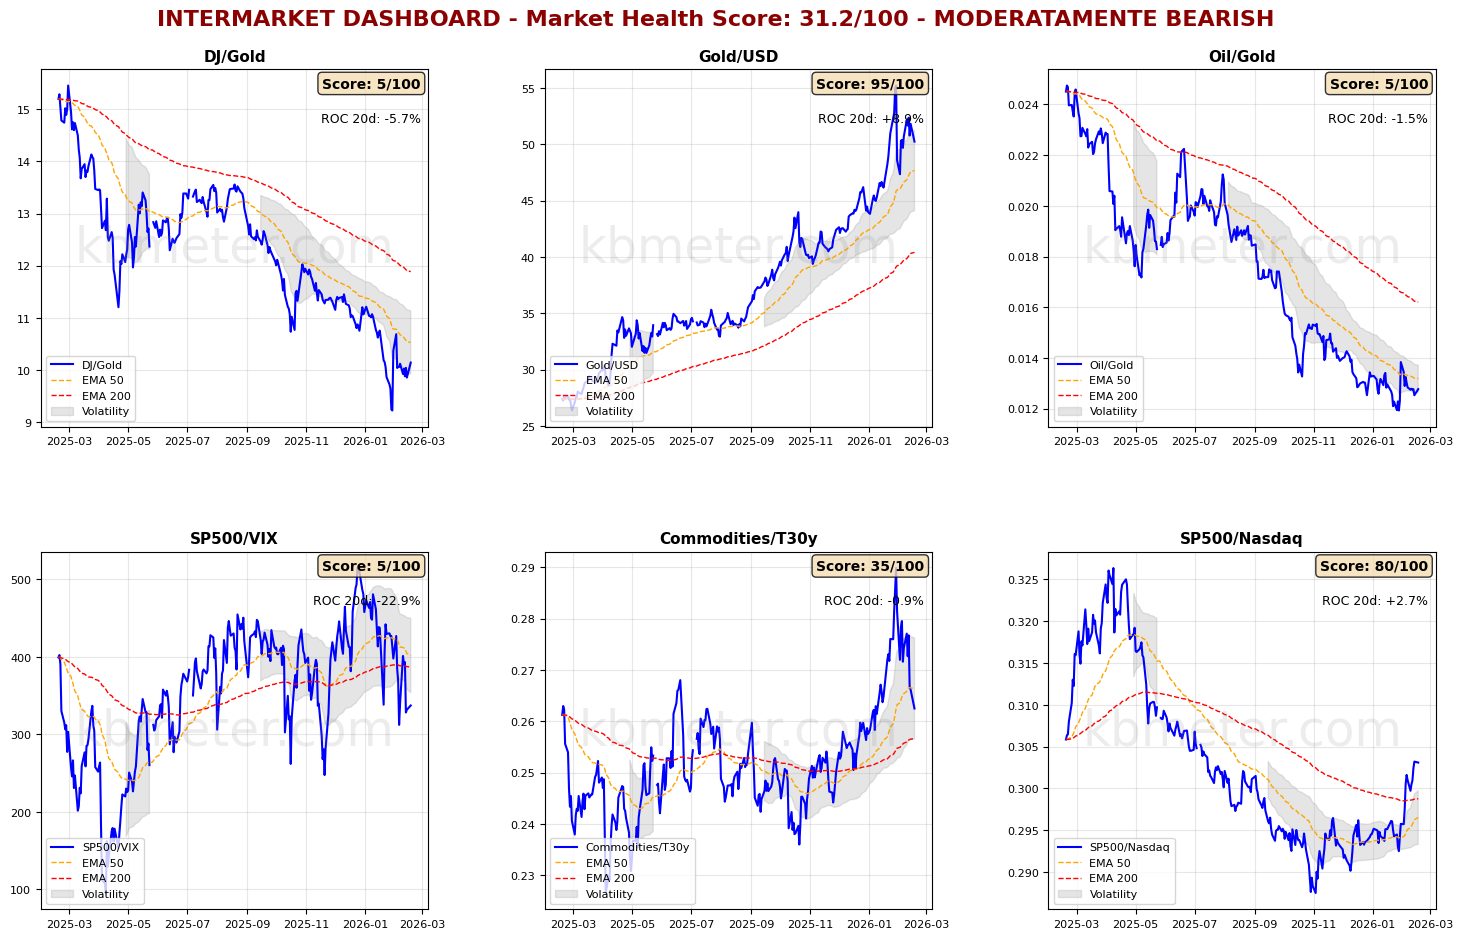
Financial markets currently show a neutral sentiment. Intermarket analysis highlights a Market Health Score of 31/100 (negative). The relatively flat session on Wall Street does not change the direction of the risk indicators in our intermarket dashboards: the S&P 500/VIX remains below the long-term moving average, with elevated volatility. No major changes across asset classes, where global bonds continue to strengthen.
Pre-Opening Futures: Global futures indicate a moderate risk-on sentiment (average +0.16%), with the U.S. slightly positive (+0.12%), Europe slightly positive (+0.31%), and Asia slightly negative (-0.21%).
📊 Global Futures – Pre-Opening Sentiment
- CAC 40 derived: +0.84%
- FTSE MIB derived: +0.74%
- Hang Seng derived: +0.68%
- CSI 300: -1.69%
- TecDAX derived: -0.25%
- Russell 2000: -0.02%
📄 Detailed Intermarket Analysis
INTERMARKET ANALYSIS - 2026-02-18
============================================================

MARKET HEALTH SCORE: 31.2/100
SENTIMENT: MODERATELY BEARISH

============================================================
SUMMARY OF MAIN RATIOS
============================================================


DJ/Gold:
  - Component score: 5.0/100
  - Current value: 10.1442
  - Position vs EMA50: BELOW
  - 20-day ROC: -5.70%
  - 50-day ROC: -11.04%
  → Flight to safe haven

Gold/USD:
  - Component score: 95.0/100
  - Current value: 50.2563
  - Position vs EMA50: ABOVE
  - 20-day ROC: +8.86%
  - 50-day ROC: +18.30%

Oil/Gold:
  - Component score: 5.0/100
  - Current value: 0.0128
  - Position vs EMA50: BELOW
  - 20-day ROC: -1.46%
  - 50-day ROC: -9.07%
  → Declining energy demand

SP500/VIX:
  - Component score: 5.0/100
  - Current value: 337.2706
  - Position vs EMA50: BELOW
  - 20-day ROC: -22.92%
  - 50-day ROC: -20.82%
  → Contracting risk appetite

Commodities/T30y:
  - Component score: 35.0/100
  - Current value: 0.2625
  - Position vs EMA50: BELOW
  - 20-day ROC: -0.87%
  - 50-day ROC: +3.67%
  → Expectations of slowdown

SP500/Nasdaq:
  - Component score: 80.0/100
  - Current value: 0.3031
  - Position vs EMA50: ABOVE
  - 20-day ROC: +2.70%
  - 50-day ROC: +3.78%
  - ⚠️ ANOMALY DETECTED - Significant deviation from the mean

============================================================
CONCLUSIONS AND RECOMMENDATIONS
============================================================

The market shows signs of weakness. Several ratios are in negative territory.
Risk appetite declining. Increase caution.
Positioning: DEFENSIVE, favor safe havens.


STRONGEST RATIOS:
  • Gold/USD: 95.0/100
  • SP500/Nasdaq: 80.0/100
  • Commodities/T30y: 35.0/100

WEAKEST RATIOS:
  • DJ/Gold: 5.0/100
  • Oil/Gold: 5.0/100
  • SP500/VIX: 5.0/100

============================================================
Analysis automatically generated by kbmeter.com
Date: 2026-02-18
📄 Detailed Asset Allocation Analysis
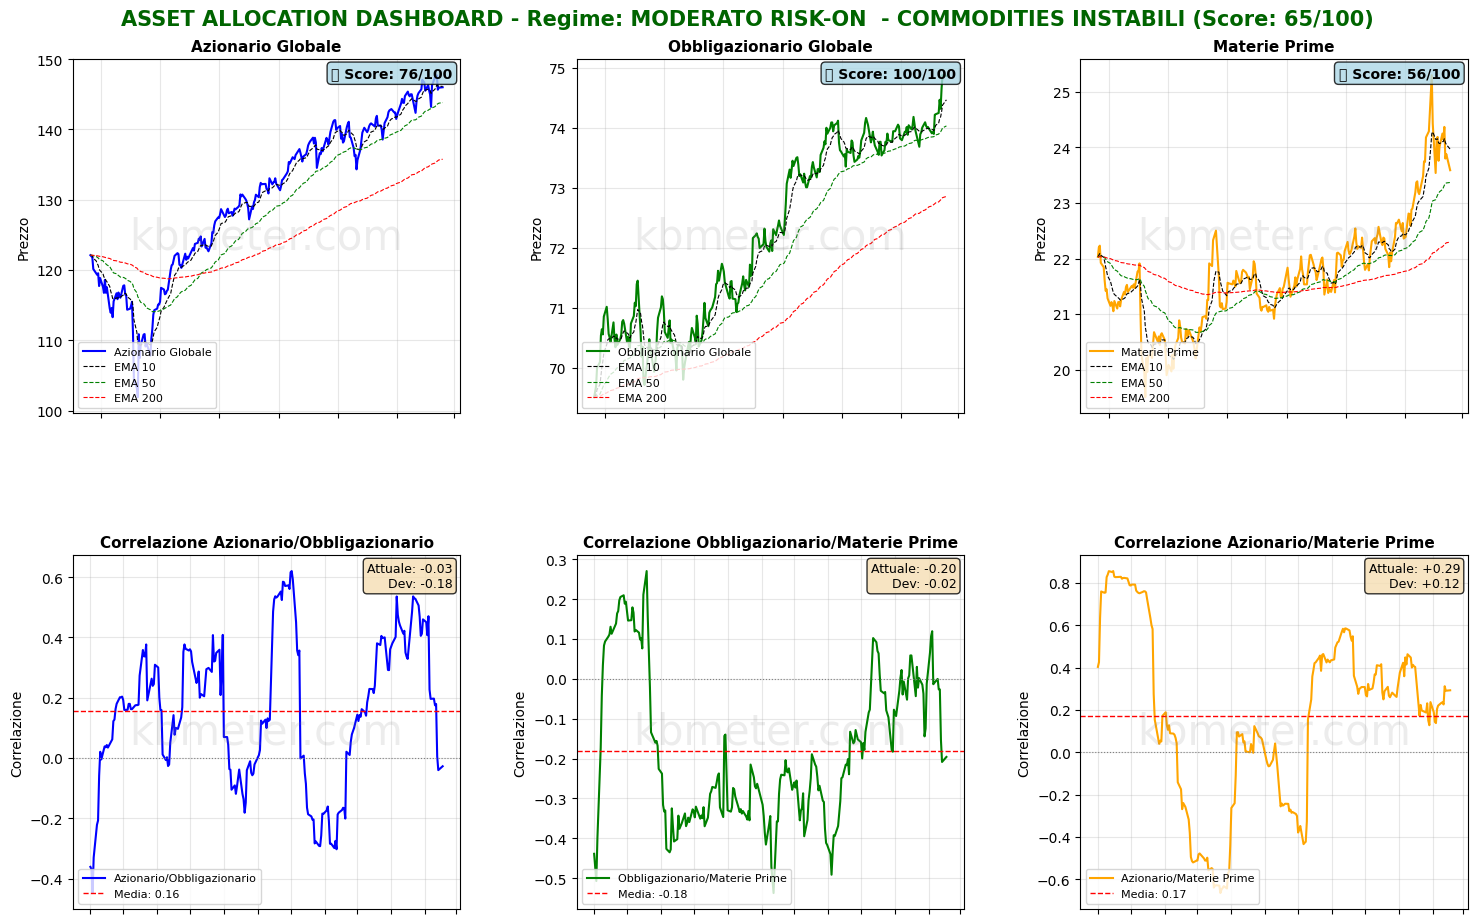
ASSET ALLOCATION & REGIME ANALYSIS - 2026-02-18
======================================================================

MARKET REGIME: MODERATE RISK-ON - UNSTABLE COMMODITIES
REGIME SCORE: 65.0/100

======================================================================
TREND AND VOLATILITY ANALYSIS
======================================================================

GLOBAL EQUITIES (ACWI):
  Short-Term Trend (5d): -0.89% | BELOW EMA 10
  Medium-Term Trend (20d): +2.56% | ABOVE EMA 50
  Long-Term Trend (60d): +7.05% | ABOVE EMA 200

  Volatility 5d: 10.9%
  Volatility 20d: 14.7%
  Volatility 60d: 11.3%

COMMODITIES (DBC):
  Medium-Term Trend (20d): +0.47% | ABOVE EMA 50
  Volatility 20d: 27.6%

ACWI/BND Correlation (30d): -0.027

REGIME INTERPRETATION:
The market shows risk appetite but with some elements of caution.
The trend is constructive but there may be mixed signals across some time horizons.
Suggested positioning: BALANCED with a slight tilt toward risk assets.

⚠️ COMMODITIES ALERT: Commodities show elevated volatility. This may
indicate uncertainty about economic growth or unstable supply/demand dynamics.

======================================================================
ASSET RANKING - TOP PERFORMERS
======================================================================

🥇 1. Global Bonds (BND) - SCORE: 100/100
     Price: $74.87
     Trend: ABOVE EMA10 | ABOVE EMA50 | ABOVE EMA200
     Performance: 5d +0.54% | 20d +1.61% | 60d +1.86%
     Volatility: 5d 4.2% | 20d 3.3% | 60d 2.9%
     Drawdown: -0.01%
     → Asset in STRONG HEALTH: positive trends and controlled volatility

🥈 2. Global Equities (ACWI) - SCORE: 76/100
     Price: $146.00
     Trend: BELOW EMA10 | ABOVE EMA50 | ABOVE EMA200
     Performance: 5d -0.89% | 20d +2.56% | 60d +7.05%
     Volatility: 5d 10.9% | 20d 14.7% | 60d 11.3%
     Drawdown: -1.16%
     → Asset in STRONG HEALTH: positive trends and controlled volatility

🥉 3. Commodities (DBC) - SCORE: 56/100
     Price: $23.59
     Trend: BELOW EMA10 | ABOVE EMA50 | ABOVE EMA200
     Performance: 5d -2.28% | 20d +0.47% | 60d +6.48%
     Volatility: 5d 20.5% | 20d 27.6% | 60d 19.1%
     Drawdown: -6.76%
     → Asset in FAIR CONDITION: predominantly positive signals

======================================================================
CORRELATION ANALYSIS - CURRENT vs HISTORICAL
======================================================================

ACWI/BND:
  Current Correlation (30d): -0.027
  Historical Average (1 year): +0.155
  Deviation: -0.183
  → Weak correlation: moderate diversification

BND/DBC:
  Current Correlation (30d): -0.196
  Historical Average (1 year): -0.180
  Deviation: -0.016

ACWI/DBC:
  Current Correlation (30d): +0.293
  Historical Average (1 year): +0.171
  Deviation: +0.122

======================================================================
OPERATIONAL SUMMARY
======================================================================

STRONGEST ASSET: Global Bonds (Score: 100/100)
WEAKEST ASSET: Commodities (Score: 56/100)

SUGGESTED ACTION: Favor the strongest asset, maintain risk exposure.
DIVERSIFICATION: EXCELLENT - Asset classes are moving independently.

======================================================================
Analysis automatically generated by kbmeter.com
Date: 2026-02-18
On the macro front, the day features important data on inflation trends in the UK. Investors should also keep an eye on U.S. industrial production and durable goods orders. Later in the evening, the minutes of the Fed’s latest meeting will also be released. On the earnings front, results are expected today from DoorDash, eBay, Analog Devices, and Moody’s.
Already a subscriber? Login here
NOTES AND WARNINGS
Analysis automatically generated by kbmeter.com. Analysis date: 18 February 2026 - 7:22 AM GMT+1
This content is provided for informational purposes only and should not be considered financial advice. All scores and assessments are based on the previous trading day’s closing prices. Futures indications refer to the date and time of the analysis.