Financial Markets Start Week Higher on Geopolitical Developments, With Focus on U.S. Jobs Data and Semiconductor Earnings
Financial markets are starting the week with sentiment ranging from neutral to moderately positive, within a risk-on environment, although volatility remains relatively elevated. Investors are focusing on the new U.S. initiative aimed at reopening the Strait of Hormuz, while on the macro front the week will bring U.S. labor market data for April and key earnings reports from the semiconductor sector. The U.S. dollar and gold remain weak. Futures indicate a positive start to the week for both Europe and the United States.
Market Weather Map
May 4, 2026
US Equities
Eu Equities
Asia Equities
Commodities
Bonds
Dollar Index
Technology
Gold
Oil
Crypto
Market Summary
Financial markets sentiment
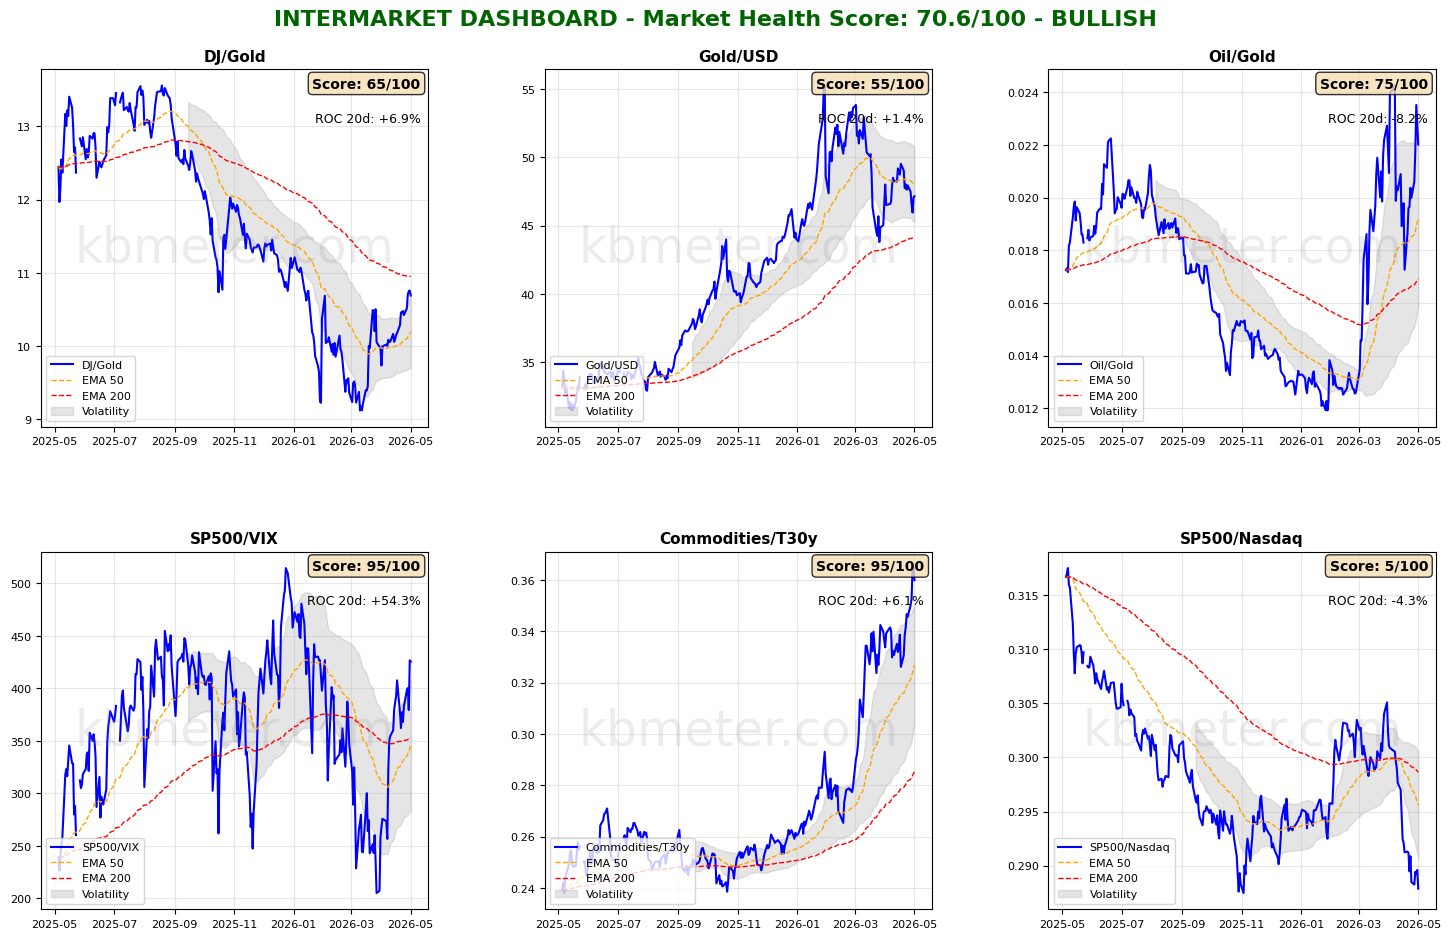
Financial markets today show a neutral to moderately positive sentiment. Intermarket analysis highlights a Market Health Score of 71/100 (positive). Our intermarket dashboards point to a slight improvement in risk appetite indicators, with the strong performance of the tech sector pushing the S&P 500/Nasdaq ratio to its lowest levels since November last year. The phase of weakness in gold and the U.S. dollar continues, while oil remains extremely volatile.
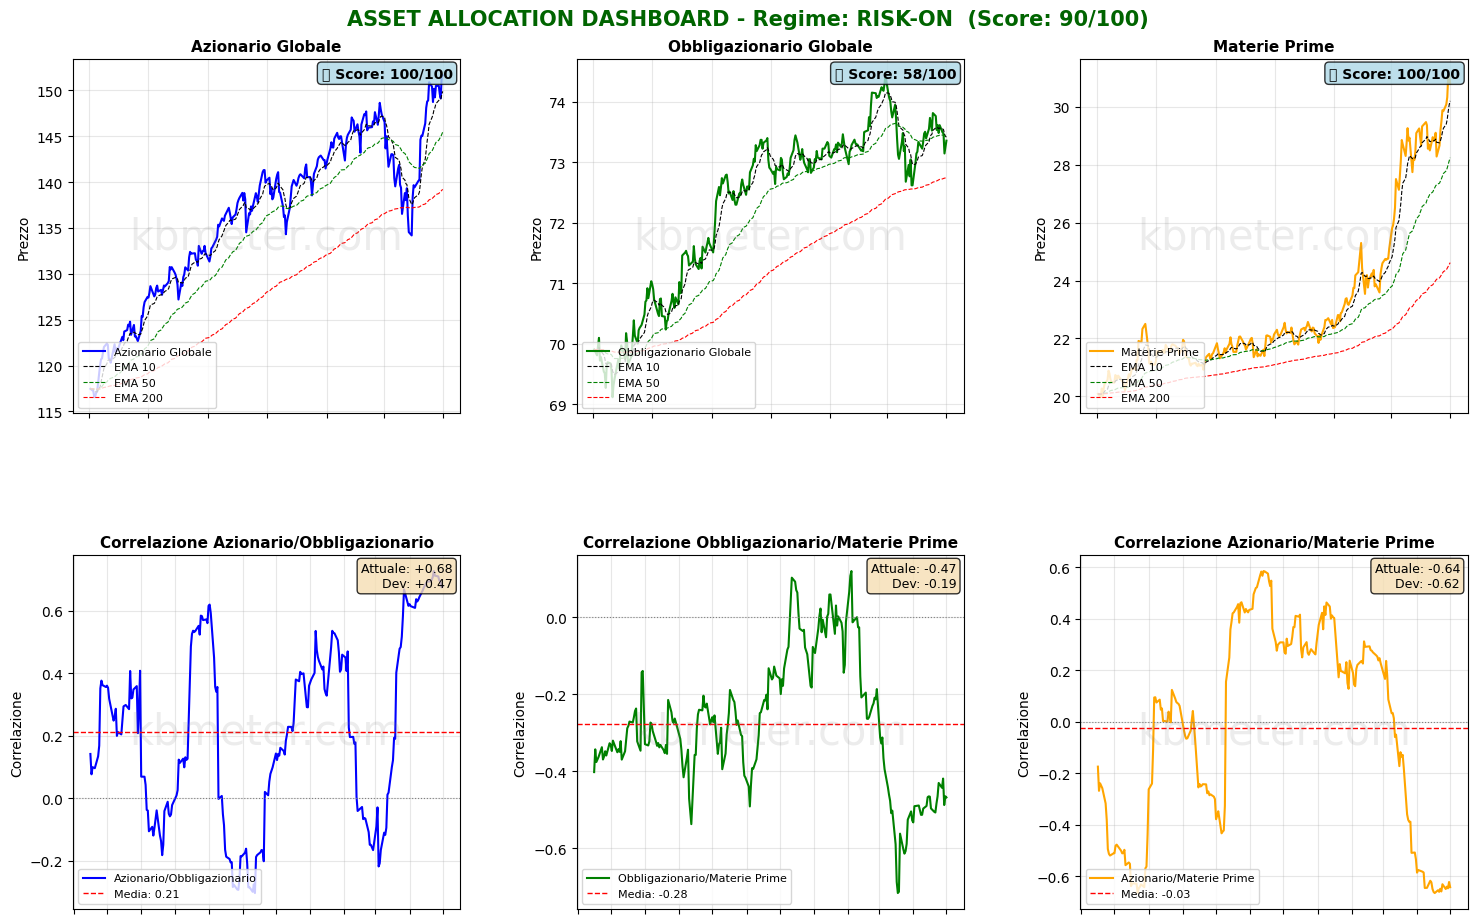
On the asset class front, there are few changes. Global equities and bonds are starting the new week around their 50-day moving average, with the correlation between the two asset classes still very high.
Global Futures – Pre-Market Sentiment
Pre-market futures: Global futures signal a moderate risk-on sentiment (average +0.50%), with the U.S. slightly positive (+0.07%), Europe positive (+0.68%), and Asia positive (+0.52%).
📊 Global Futures – Pre-Market Sentiment
- TecDAX derived: +2.15%
- IBEX 35 derived: +1.63%
- Nikkei 225 derived: +0.94%
- Dow Jones 30 cv1: -0.38%
- CSI 300: -0.02%
- Mini MDAX derived: +0.00%
Intermarket details
📄 Detailed Intermarket Analysis
INTERMARKET ANALYSIS - 2026-05-04
============================================================

MARKET HEALTH SCORE: 70.6/100
SENTIMENT: BULLISH

============================================================
SUMMARY OF KEY RATIOS
============================================================


DJ/Gold:
  - Component score: 65.0/100
  - Current value: 10.6912
  - Position vs EMA50: ABOVE
  - 20-day ROC: +6.94%
  - 50-day ROC: +7.70%
  → Preference for risk assets vs safe haven

Gold/USD:
  - Component score: 55.0/100
  - Current value: 47.1429
  - Position vs EMA50: BELOW
  - 20-day ROC: +1.38%
  - 50-day ROC: -7.22%

Oil/Gold:
  - Component score: 75.0/100
  - Current value: 0.0220
  - Position vs EMA50: ABOVE
  - 20-day ROC: -8.18%
  - 50-day ROC: +64.92%
  → Declining energy demand

SP500/VIX:
  - Component score: 95.0/100
  - Current value: 425.5515
  - Position vs EMA50: ABOVE
  - 20-day ROC: +54.31%
  - 50-day ROC: +25.46%
  → Expanding risk appetite

Commodities/T30y:
  - Component score: 95.0/100
  - Current value: 0.3599
  - Position vs EMA50: ABOVE
  - 20-day ROC: +6.10%
  - 50-day ROC: +30.58%
  → Economic growth expectations

SP500/Nasdaq:
  - Component score: 5.0/100
  - Current value: 0.2879
  - Position vs EMA50: BELOW
  - 20-day ROC: -4.31%
  - 50-day ROC: -4.84%

============================================================
CONCLUSIONS AND RECOMMENDATIONS
============================================================

The market shows signs of broad strength. Intermarket ratios suggest
a risk-friendly environment. Elevated risk appetite and positive trends.
Positioning: CONSTRUCTIVE on risk assets.


STRONGEST RATIOS:
  • SP500/VIX: 95.0/100
  • Commodities/T30y: 95.0/100
  • Oil/Gold: 75.0/100

WEAKEST RATIOS:
  • DJ/Gold: 65.0/100
  • Gold/USD: 55.0/100
  • SP500/Nasdaq: 5.0/100

============================================================
Analysis automatically generated by kbmeter.com
Date: 2026-05-04
📄 Detailed Asset Allocation Analysis
ASSET ALLOCATION & REGIME ANALYSIS - 2026-05-04
======================================================================

MARKET REGIME: RISK-ON
REGIME SCORE: 90.0/100

======================================================================
TREND AND VOLATILITY ANALYSIS
======================================================================

GLOBAL EQUITIES (ACWI):
  Short-Term Trend (5d): +0.76% | ABOVE EMA 10
  Medium-Term Trend (20d): +8.21% | ABOVE EMA 50
  Long-Term Trend (60d): +5.90% | ABOVE EMA 200

  5d Volatility: 13.6%
  20d Volatility: 15.2%
  60d Volatility: 17.8%

COMMODITIES (DBC):
  Medium-Term Trend (20d): +4.51% | ABOVE EMA 50
  20d Volatility: 21.6%

ACWI/BND Correlation (30d): 0.678

REGIME INTERPRETATION:
The market is in a risk-on regime. Equities show positive trends across multiple
time horizons and volatility is contained. Investors favor risk assets.
Suggested positioning: OVERWEIGHT equities.

======================================================================
ASSET RANKING - WHICH PERFORMS BEST?
======================================================================

🥇 1. Global Equities (ACWI) - SCORE: 100/100
     Price: $151.66
     Trend: ABOVE EMA10 | ABOVE EMA50 | ABOVE EMA200
     Performance: 5d +0.76% | 20d +8.21% | 60d +5.90%
     Volatility: 5d 13.6% | 20d 15.2% | 60d 17.8%
     Drawdown: 0.00%
     → Asset in STRONG HEALTH: positive trends and controlled volatility

🥈 2. Commodities (DBC) - SCORE: 100/100
     Price: $30.81
     Trend: ABOVE EMA10 | ABOVE EMA50 | ABOVE EMA200
     Performance: 5d +2.39% | 20d +4.51% | 60d +29.67%
     Volatility: 5d 19.6% | 20d 21.6% | 60d 23.9%
     Drawdown: -0.93%
     → Asset in STRONG HEALTH: positive trends and controlled volatility

🥉 3. Global Bonds (BND) - SCORE: 58/100
     Price: $73.36
     Trend: BELOW EMA10 | BELOW EMA50 | ABOVE EMA200
     Performance: 5d -0.19% | 20d +0.18% | 60d -0.19%
     Volatility: 5d 3.9% | 20d 3.4% | 60d 4.3%
     Drawdown: -1.45%
     → Asset in FAIR condition: mostly positive signals

======================================================================
CORRELATION ANALYSIS - CURRENT vs HISTORICAL
======================================================================

ACWI/BND:
  Current correlation (30d): +0.678
  Historical average (1 year): +0.213
  Deviation: +0.465
  ⚠️ SIGNIFICANT DEVIATION from historical average
  → Positive correlation: diversification COMPROMISED

BND/DBC:
  Current correlation (30d): -0.468
  Historical average (1 year): -0.278
  Deviation: -0.190

ACWI/DBC:
  Current correlation (30d): -0.643
  Historical average (1 year): -0.026
  Deviation: -0.617
  ⚠️ SIGNIFICANT DEVIATION from historical average
  → Negative correlation: possible supply-driven shift

======================================================================
OPERATIONAL SUMMARY
======================================================================

STRONGEST ASSET: Global Equities (Score: 100/100)
WEAKEST ASSET: Global Bonds (Score: 58/100)

SUGGESTED ACTION: Favor the strongest asset, maintain risk exposure.
DIVERSIFICATION: GOOD - Diversification benefits present.

======================================================================
Analysis automatically generated by kbmeter.com
Date: 2026-05-04
Macroeconomic Calendar
On the macro side, today’s agenda includes the final April PMI readings and U.S. factory orders data for March 2026. As for earnings, today the focus is on Palantir, Tyson Foods, Lattice, and ON Semiconductor.
Already a subscriber? Login here
NOTES AND WARNINGS
Data compiled by kbmeter.com. Analysis date: 4 May 2026 - 7:21 AM GMT+1
This content is provided for informational purposes only and should not be considered financial advice. All scores and assessments are based on the previous trading day’s closing prices. Futures indications refer to the date and time of the analysis.