Financial Markets Split Between Tech Rally and Inflation Bets Reviving the Dollar
Financial markets appear to be moving on multiple fronts as the week draws to a close. On one side, equities — driven by the technology sector — continue their short-term upward trend; on the other, inflation expectations are pushing bond yields higher and strengthening the dollar (at the expense of gold). In the background, with no major new developments, oil continues to trade around the $100 area.
Which front will become the priority is the key question facing — and likely to continue facing — investors over the coming days. In the meantime, the data suggests that overall sentiment remains tilted toward risk-on, while volatility has declined significantly over the past week. Futures point to a slightly negative opening for Europe and a weaker start for the United States.
Market Weather Map
May 15, 2026
US Equities
Eu Equities
Asia Equities
Commodities
Bonds
Dollar Index
Technology
Gold
Oil
Crypto
Market Summary
Financial Markets sentiment
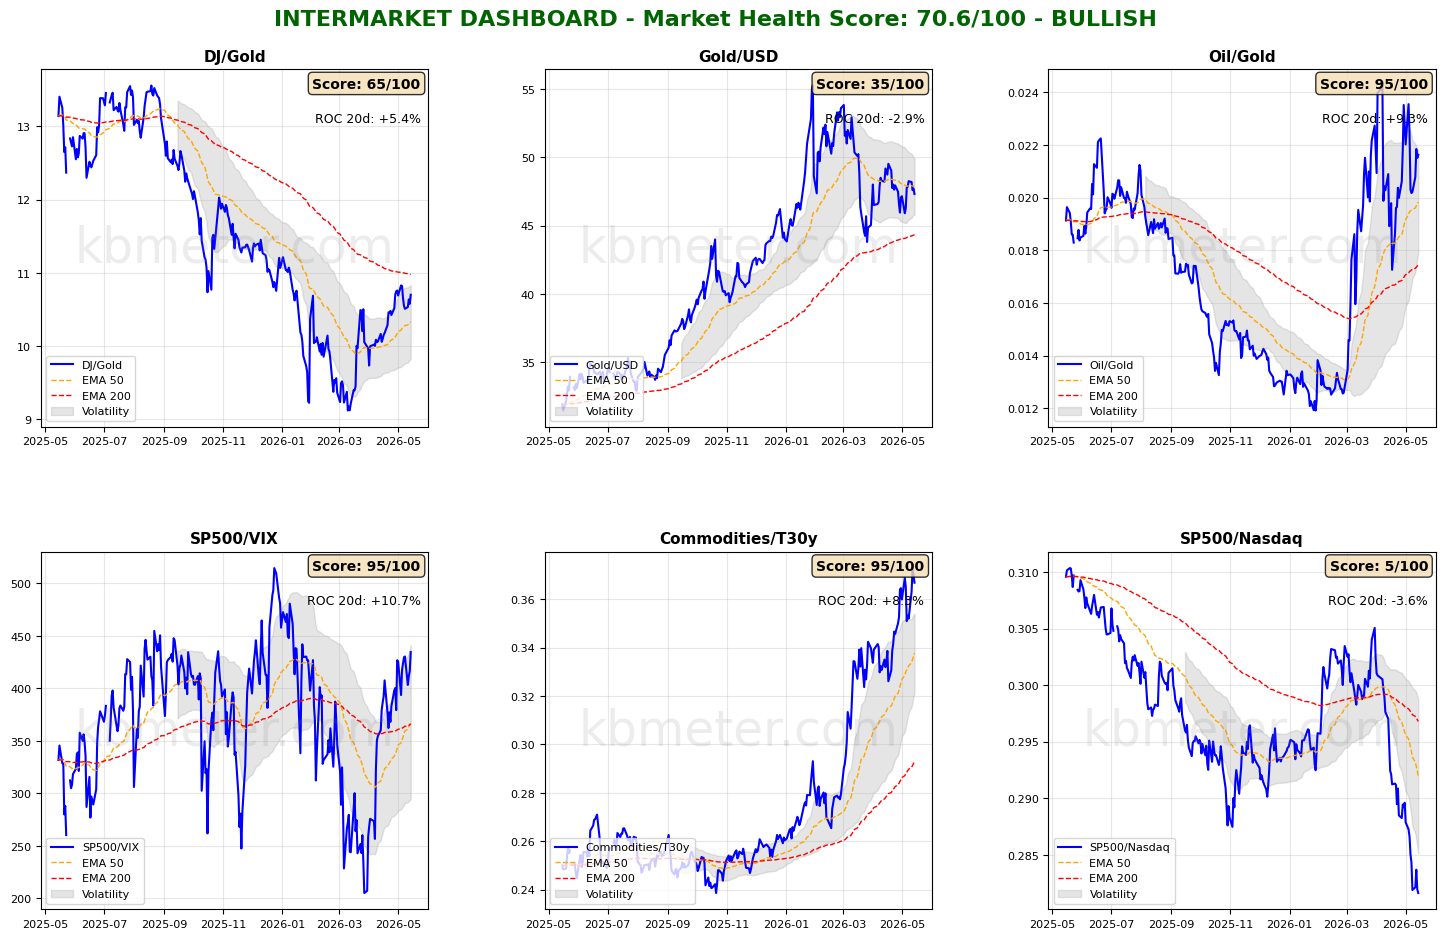
Financial markets currently display a neutral to moderately positive sentiment. Intermarket analysis shows a Market Health Score of 71/100 (positive). Conditions remain broadly unchanged across our intermarket dashboards, with risk appetite indicators continuing to stay in positive territory and the technology sector maintaining its upward momentum. Gold remains weak relative to oil, the strengthening dollar, and the Dow.
There have also been limited movements across asset classes. Global equities continue to confirm their short-term bullish trend, while fixed income remains around the 50-day moving average, in what is effectively a short-term sideways pattern. Commodities continue to trend higher.
Our market weather map shows a general improvement in Scores, with today’s key development being the strong rebound of the dollar, partly supported by encouraging U.S. consumer spending data and partly by expectations of higher interest rates.
Global Futures – Pre-Market Sentiment
Pre-Opening Futures: Global futures indicate a risk-off sentiment (-0.61% on average), with the U.S. negative (-0.61%), Europe slightly negative (-0.20%), and Asia sharply lower (-1.83%).
📊 Global Futures – Pre-Market Sentiment
- TecDAX derived: +1.91%
- FTSE MIB derived: +1.16%
- IBEX 35 derived: +0.21%
- Nikkei 225 derived: -2.37%
- CSI 300: -1.77%
- DAX derived: -1.39%
Intermarket details
📄 Detailed Intermarket Analysis
INTERMARKET ANALYSIS - 2026-05-15
============================================================

MARKET HEALTH SCORE: 70.6/100
SENTIMENT: BULLISH

============================================================
SUMMARY OF MAIN RATIOS
============================================================


DJ/Gold:
  - Component score: 65.0/100
  - Current value: 10.7017
  - Position vs EMA50: ABOVE
  - 20-day ROC: +5.42%
  - 50-day ROC: +12.42%
  → Preference for risky assets vs safe haven

Gold/USD:
  - Component score: 35.0/100
  - Current value: 47.3109
  - Position vs EMA50: BELOW
  - 20-day ROC: -2.89%
  - 50-day ROC: -8.74%

Oil/Gold:
  - Component score: 95.0/100
  - Current value: 0.0216
  - Position vs EMA50: ABOVE
  - 20-day ROC: +9.29%
  - 50-day ROC: +48.31%
  → Rising energy demand

SP500/VIX:
  - Component score: 95.0/100
  - Current value: 434.6026
  - Position vs EMA50: ABOVE
  - 20-day ROC: +10.73%
  - 50-day ROC: +33.81%
  → Expanding risk appetite

Commodities/T30y:
  - Component score: 95.0/100
  - Current value: 0.3668
  - Position vs EMA50: ABOVE
  - 20-day ROC: +8.32%
  - 50-day ROC: +24.15%
  → Economic growth expectations

SP500/Nasdaq:
  - Component score: 5.0/100
  - Current value: 0.2816
  - Position vs EMA50: BELOW
  - 20-day ROC: -3.60%
  - 50-day ROC: -6.50%

============================================================
CONCLUSIONS AND RECOMMENDATIONS
============================================================

The market is showing broad signs of strength. Intermarket ratios suggest
a risk-friendly environment. Strong risk appetite and positive trends.
Positioning: CONSTRUCTIVE on risky assets.


STRONGEST RATIOS:
  • Oil/Gold: 95.0/100
  • SP500/VIX: 95.0/100
  • Commodities/T30y: 95.0/100

WEAKEST RATIOS:
  • DJ/Gold: 65.0/100
  • Gold/USD: 35.0/100
  • SP500/Nasdaq: 5.0/100

============================================================
Data processed by kbmeter.com
Date: 2026-05-15
📄 Detailed Asset Allocation Analysis
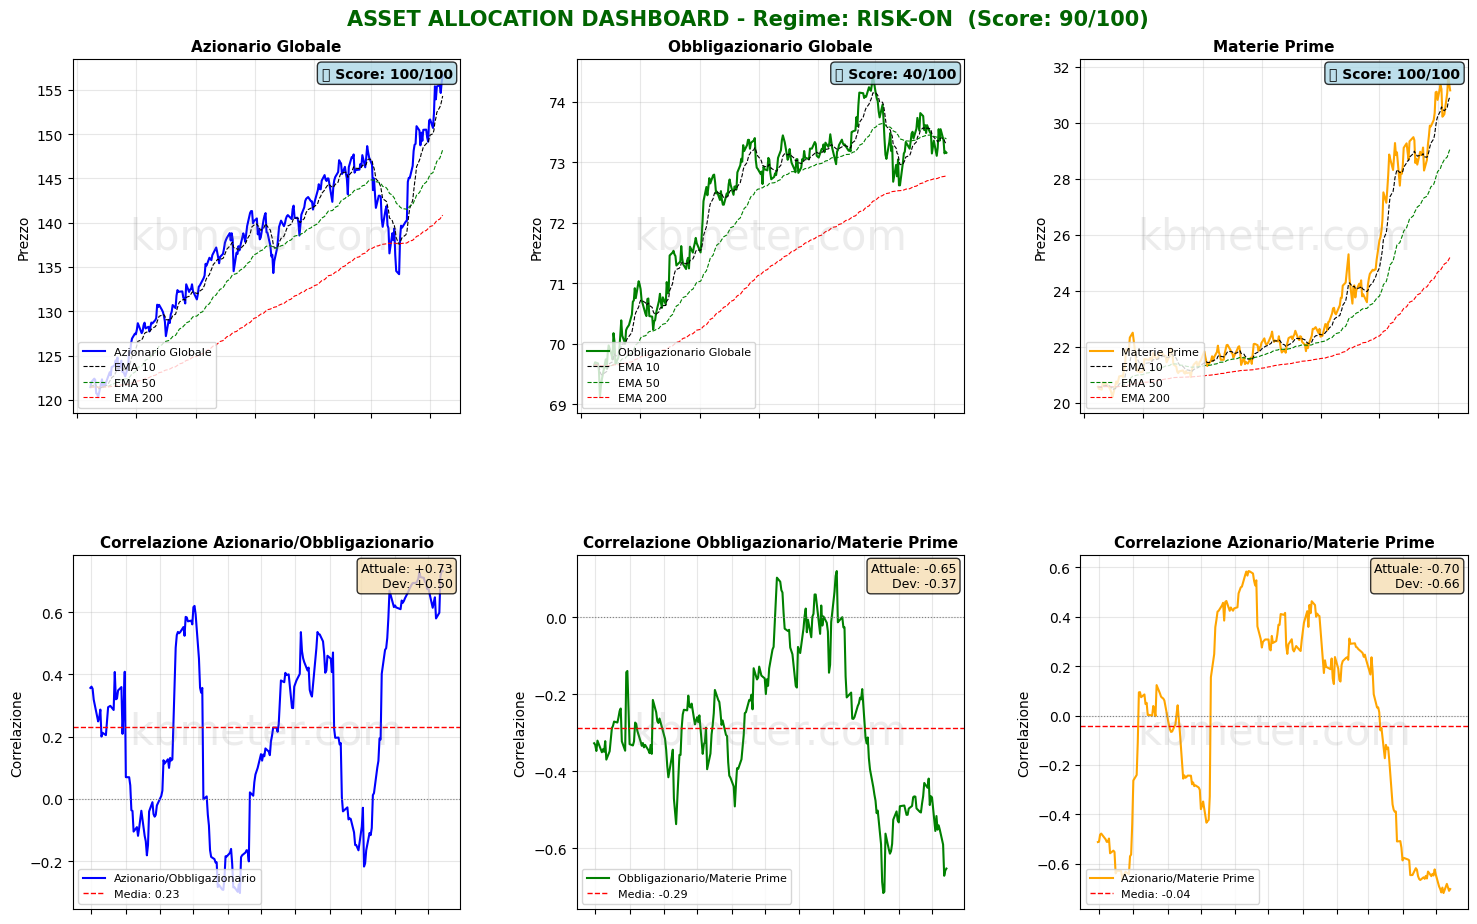
ASSET ALLOCATION & REGIME ANALYSIS - 2026-05-15
======================================================================

MARKET REGIME: RISK-ON
REGIME SCORE: 90.0/100

======================================================================
TREND AND VOLATILITY ANALYSIS
======================================================================

GLOBAL EQUITIES (ACWI):
  Short-Term Trend (5d): +0.82% | ABOVE EMA 10
  Medium-Term Trend (20d): +3.81% | ABOVE EMA 50
  Long-Term Trend (60d): +7.05% | ABOVE EMA 200

  5d Volatility: 9.6%
  20d Volatility: 14.3%
  60d Volatility: 17.7%

COMMODITIES (DBC):
  Medium-Term Trend (20d): +10.11% | ABOVE EMA 50
  20d Volatility: 24.9%

ACWI/BND Correlation (30d): 0.732

REGIME INTERPRETATION:
The market is currently in a risk-on regime. Equities are showing positive trends across multiple time horizons,
while volatility remains contained. Investors continue to favor risky assets.
Suggested positioning: OVERWEIGHT equities.

======================================================================
ASSET RANKING - WHO IS PERFORMING BEST?
======================================================================

🥇 1. Global Equities (ACWI) - SCORE: 100/100
     Price: $156.65
     Trend: ABOVE EMA10 | ABOVE EMA50 | ABOVE EMA200
     Performance: 5d +0.82% | 20d +3.81% | 60d +7.05%
     Volatility: 5d 9.6% | 20d 14.3% | 60d 17.7%
     Drawdown: 0.00%
     → Asset in STRONG HEALTH: positive trends and controlled volatility

🥈 2. Commodities (DBC) - SCORE: 100/100
     Price: $31.15
     Trend: ABOVE EMA10 | ABOVE EMA50 | ABOVE EMA200
     Performance: 5d +2.81% | 20d +10.11% | 60d +27.51%
     Volatility: 5d 25.3% | 20d 24.9% | 60d 24.3%
     Drawdown: -1.70%
     → Asset in STRONG HEALTH: positive trends and controlled volatility

🥉 3. Global Bonds (BND) - SCORE: 40/100
     Price: $73.16
     Trend: BELOW EMA10 | BELOW EMA50 | ABOVE EMA200
     Performance: 5d -0.53% | 20d -0.89% | 60d -1.26%
     Volatility: 5d 3.6% | 20d 4.0% | 60d 4.3%
     Drawdown: -1.72%
     → Asset in WEAK CONDITIONS: negative trends or elevated volatility

======================================================================
CORRELATION ANALYSIS - CURRENT vs HISTORICAL
======================================================================

ACWI/BND:
  Current Correlation (30d): +0.732
  Historical Average (1 year): +0.232
  Deviation: +0.500
  ⚠️ SIGNIFICANT DEVIATION from historical average
  → Positive correlation: diversification COMPROMISED

BND/DBC:
  Current Correlation (30d): -0.652
  Historical Average (1 year): -0.287
  Deviation: -0.366
  ⚠️ SIGNIFICANT DEVIATION from historical average

ACWI/DBC:
  Current Correlation (30d): -0.702
  Historical Average (1 year): -0.040
  Deviation: -0.662
  ⚠️ SIGNIFICANT DEVIATION from historical average
  → Negative correlation: possible supply-driven shift

======================================================================
OPERATIONAL SUMMARY
======================================================================

STRONGEST ASSET: Global Equities (Score: 100/100)
WEAKEST ASSET: Global Bonds (Score: 40/100)

SUGGESTED ACTION: Favor the strongest asset and maintain risk exposure.
DIVERSIFICATION: WEAK - Asset classes tend to move together.

======================================================================
Data processed by kbmeter.com
Date: 2026-05-15
Macroeconomic Calendar
On the macro front, the day offers few catalysts, all concentrated in the United States. Markets are awaiting the May update of the Empire State Index and April 2026 industrial production data.
Already a subscriber? Login here
NOTES AND WARNINGS
Data compiled by kbmeter.com. Analysis date: 15 May 2026 - 7:55 AM GMT+1
This content is provided for informational purposes only and should not be considered financial advice. All scores and assessments are based on the previous trading day’s closing prices. Futures indications refer to the date and time of the analysis.