Financial Markets Sideline Middle East Tensions, Turn Focus to Tesla and IBM Earnings
With the second round of negotiations between the United States and Iran having fallen through, and the extension of the ceasefire, financial markets will likely try to shift their focus elsewhere today, awaiting greater clarity on the evolution of the geopolitical situation. And “elsewhere” today includes major names such as Tesla and IBM, which will release their Q1 2026 earnings and provide guidance for the coming months.
In a context that remains broadly risk-on, albeit with significant volatility, gold and the US dollar continue to duel over differing economic outlooks, while the technology sector shows renewed strength despite many underlying structural weaknesses.
Futures indicate a positive opening for the United States, while Europe is expected to start slightly below parity.
Market Weather Map
April 22, 2026
US Equities
Eu Equities
Asia Equities
Commodities
Bonds
Dollar Index
Technology
Gold
Oil
Crypto
Market Summary
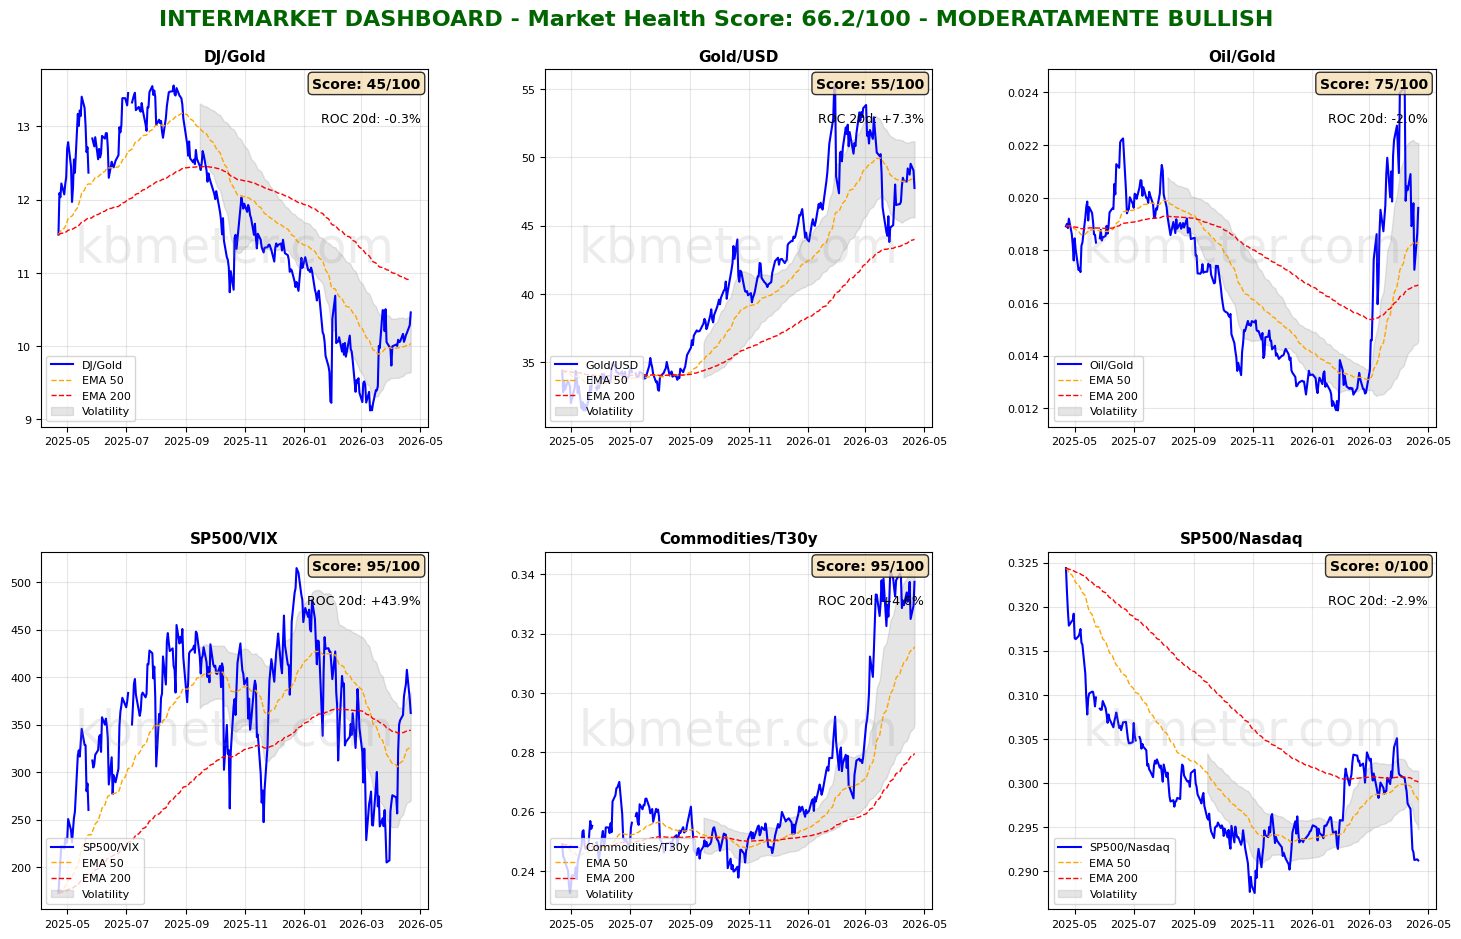
Financial markets are showing a moderately positive sentiment today. Intermarket analysis highlights a Market Health Score of 66/100 (positive). There are few new developments regarding our macro dashboards. Beyond “headline-driven” adjustments—caused by the rapid succession of conflicting news related to the Middle East crisis—risk appetite indicators remain stable. Confirmation of this framework also comes from the heightened volatility in the Oil/Gold ratio and the brief recovery of the dollar against bullion, which was quickly halted following the US announcement of the ceasefire extension.
Across asset classes, this constant flow of news is translating into a clear slowdown in the rebound of global equities and bonds, though without particularly significant signals regarding future direction.
As for our “weather map,” it is worth noting that the tech sector, ahead of key earnings releases such as those from Tesla and IBM, has moved above the 60-point Health Score level. The two recent attempts to remain above this threshold (January and early April) were rejected. A stable presence above 60 has not been seen since October last year.
Pre-market futures: Global futures indicate a moderate risk-on sentiment (average +0.07%), with the US positive (+0.56%), Europe slightly negative (-0.22%), and Asia slightly positive (+0.27%).
📊 Global Futures – Pre-Market Sentiment
- Nikkei 225 derived: +0.94%
- Russell 2000: +0.76%
- US Tech 100 derived: +0.62%
- IBEX 35 derived: -0.83%
- FTSE MIB derived: -0.62%
- Euro Stoxx 50 derived: -0.39%
📄 Detailed Intermarket Analysis
INTERMARKET ANALYSIS - 2026-04-22
============================================================

MARKET HEALTH SCORE: 66.2/100
SENTIMENT: MODERATELY BULLISH

============================================================
MAIN RATIO SUMMARY
============================================================


DJ/Gold:
  - Component score: 45.0/100
  - Current value: 10.4609
  - Position vs EMA50: ABOVE
  - 20-day ROC: -0.30%
  - 50-day ROC: +3.35%
  → Preference for risk assets vs safe havens

Gold/USD:
  - Component score: 55.0/100
  - Current value: 47.7431
  - Position vs EMA50: BELOW
  - 20-day ROC: +7.27%
  - 50-day ROC: -5.86%

Oil/Gold:
  - Component score: 75.0/100
  - Current value: 0.0196
  - Position vs EMA50: ABOVE
  - 20-day ROC: -2.01%
  - 50-day ROC: +52.77%
  → Declining energy demand

SP500/VIX:
  - Component score: 95.0/100
  - Current value: 362.2569
  - Position vs EMA50: ABOVE
  - 20-day ROC: +43.94%
  - 50-day ROC: +6.45%
  → Expanding risk appetite

Commodities/T30y:
  - Component score: 95.0/100
  - Current value: 0.3374
  - Position vs EMA50: ABOVE
  - 20-day ROC: +4.62%
  - 50-day ROC: +22.13%
  → Economic growth expectations

SP500/Nasdaq:
  - Component score: 0.0/100
  - Current value: 0.2912
  - Position vs EMA50: BELOW
  - 20-day ROC: -2.90%
  - 50-day ROC: -3.26%
  - ⚠️ ANOMALY DETECTED - Significant deviation from the mean

============================================================
CONCLUSIONS AND RECOMMENDATIONS
============================================================

The market is moderately constructive. Some ratios show positive signals,
but elements of caution remain. Monitor developments.
Positioning: SELECTIVE, favor quality.


STRONGEST RATIOS:
  • SP500/VIX: 95.0/100
  • Commodities/T30y: 95.0/100
  • Oil/Gold: 75.0/100

WEAKEST RATIOS:
  • Gold/USD: 55.0/100
  • DJ/Gold: 45.0/100
  • SP500/Nasdaq: 0.0/100

============================================================
Analysis automatically generated by kbmeter.com
Date: 2026-04-22
📄 Detailed Asset Allocation Analysis
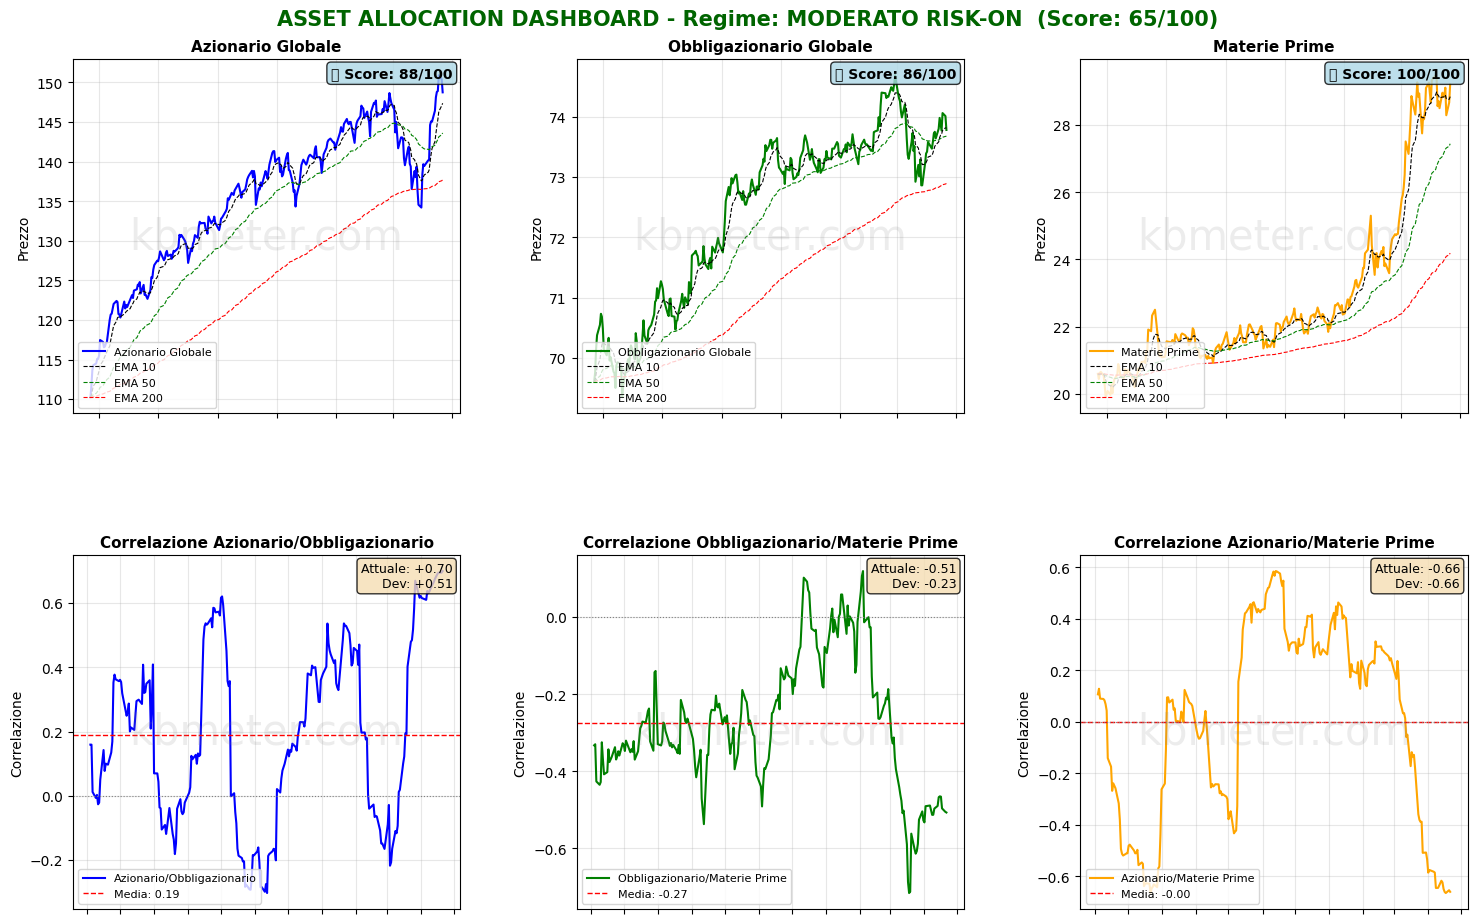
ASSET ALLOCATION & REGIME ANALYSIS - 2026-04-22
======================================================================

MARKET REGIME: MODERATE RISK-ON
REGIME SCORE: 65.0/100

======================================================================
TREND AND VOLATILITY ANALYSIS
======================================================================

GLOBAL EQUITIES (ACWI):
  Short-Term Trend (5d): -0.04% | ABOVE EMA 10
  Medium-Term Trend (20d): +7.75% | ABOVE EMA 50
  Long-Term Trend (60d): +2.07% | ABOVE EMA 200

  Volatility 5d: 14.5%
  Volatility 20d: 20.5%
  Volatility 60d: 17.5%

COMMODITIES (DBC):
  Medium-Term Trend (20d): +3.43% | ABOVE EMA 50
  Volatility 20d: 23.3%

ACWI/BND Correlation (30d): 0.699

REGIME INTERPRETATION:
The market shows risk appetite but with some elements of caution.
The trend is constructive, but conflicting signals may appear across certain time horizons.
Suggested positioning: BALANCED with a slight tilt toward risk assets.

======================================================================
ASSET RANKING - WHO IS PERFORMING BEST?
======================================================================

🥇 1. Commodities (DBC) - SCORE: 100/100
     Price: $29.21
     Trend: ABOVE EMA10 | ABOVE EMA50 | ABOVE EMA200
     Performance: 5d +1.11% | 20d +3.43% | 60d +20.26%
     Volatility: 5d 29.2% | 20d 23.3% | 60d 26.5%
     Drawdown: -0.92%
     → Asset in STRONG HEALTH: positive trends and controlled volatility

🥈 2. Global Equities (ACWI) - SCORE: 88/100
     Price: $148.74
     Trend: ABOVE EMA10 | ABOVE EMA50 | ABOVE EMA200
     Performance: 5d -0.04% | 20d +7.75% | 60d +2.07%
     Volatility: 5d 14.5% | 20d 20.5% | 60d 17.5%
     Drawdown: -1.43%
     → Asset in STRONG HEALTH: positive trends and controlled volatility

🥉 3. Global Bonds (BND) - SCORE: 86/100
     Price: $73.78
     Trend: BELOW EMA10 | ABOVE EMA50 | ABOVE EMA200
     Performance: 5d -0.14% | 20d +1.05% | 60d +0.22%
     Volatility: 5d 4.2% | 20d 4.3% | 60d 4.2%
     Drawdown: -1.22%
     → Asset in STRONG HEALTH: positive trends and controlled volatility

======================================================================
CORRELATION ANALYSIS - CURRENT vs HISTORICAL
======================================================================

ACWI/BND:
  Current correlation (30d): +0.699
  Historical average (1 year): +0.189
  Deviation: +0.510
  ⚠️ SIGNIFICANT DEVIATION from historical average
  → Positive correlation: diversification COMPROMISED

BND/DBC:
  Current correlation (30d): -0.507
  Historical average (1 year): -0.275
  Deviation: -0.232

ACWI/DBC:
  Current correlation (30d): -0.661
  Historical average (1 year): -0.001
  Deviation: -0.660
  ⚠️ SIGNIFICANT DEVIATION from historical average
  → Negative correlation: possible supply-driven shift

======================================================================
OPERATIONAL SUMMARY
======================================================================

STRONGEST ASSET: Commodities (Score: 100/100)
WEAKEST ASSET: Global Bonds (Score: 86/100)

SUGGESTED ACTION: Favor the strongest asset, maintain risk exposure.
DIVERSIFICATION: POOR - Asset classes tend to move together.

======================================================================
Analysis automatically generated by kbmeter.com
Date: 2026-04-22
On the macro front, today’s agenda includes UK inflation data for March, Japanese exports (also for March 2026), and the flash estimate of consumer confidence in the Eurozone for April.
It is a busy day on the earnings front. Today is the day for Tesla and IBM, but investors should also keep an eye on results from Boeing, AT&T, and Philip Morris.
Already a subscriber? Login here
NOTES AND WARNINGS
Data compiled by kbmeter.com. Analysis date: 22 April 2026 - 8:11 AM GMT+1
This content is provided for informational purposes only and should not be considered financial advice. All scores and assessments are based on the previous trading day’s closing prices. Futures indications refer to the date and time of the analysis.