Financial markets remain in a neutral sentiment phase, but earnings (banks and TSM) are providing some relief
Financial markets remain in a neutral sentiment phase. The latest “heavyweight” earnings of the week (banks and semiconductors) have provided some relief to U.S. equity indices, while European markets remain somewhat more uncertain. Volatility stays at normal levels. Gold is stable, while the dollar index remains firm.
Market Weather Map
January 16, 2026
US Equities
Eu Equities
Asia Equities
Commodities
Bonds
Dollar Index
Technology
Gold
Oil
Crypto
Market Summary
📊 Global Futures – Pre-Market Sentiment
- FTSE MIB derived: +0.43%
- US Tech 100 derived: +0.41%
- Russell 2000: +0.31%
- Hang Seng derived: -1.34%
- IBEX 35 derived: -0.52%
- TecDAX derived: -0.46%
Pre-Open Futures: Global futures point to a moderately risk-off sentiment (average -0.12%), with the U.S. slightly positive (+0.29%), Europe slightly negative (-0.22%), and Asia slightly negative (-0.37%).
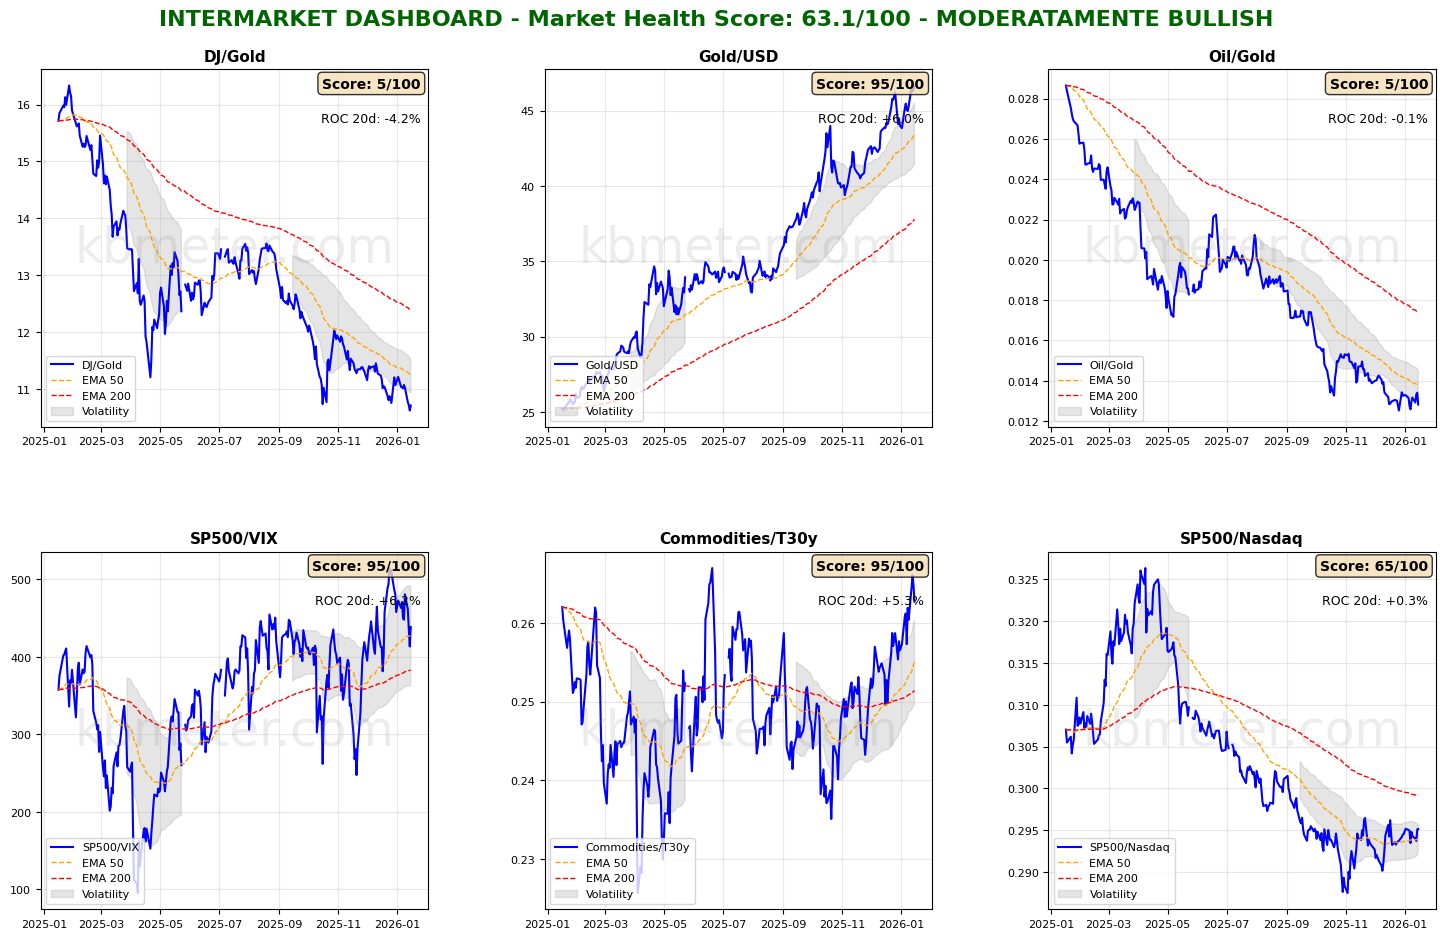
Based on our scores, financial markets continue to show a neutral sentiment. Intermarket analysis highlights a Market Health Score of 63/100 (moderately positive), with gold still in a position of strength and risk indicators remaining in positive territory, albeit with limited momentum. Major asset classes remain biased to the upside, with correlations currently all in positive territory.
Volatility remains at moderate levels, consistent with a normal market environment. Monitoring the evolution of the macro backdrop and the potential emergence of new catalysts remains essential
📄 Detailed Intermarket Analysis
INTERMARKET ANALYSIS - 2026-01-16
============================================================

MARKET HEALTH SCORE: 63.1/100
SENTIMENT: MODERATELY BULLISH

============================================================
KEY RATIO SUMMARY
============================================================


DJ/Gold:
  - Component score: 5.0/100
  - Current value: 10.7104
  - Position vs EMA50: BELOW
  - 20-day ROC: -4.18%
  - 50-day ROC: -9.49%
  → Flight to safe haven

Gold/USD:
  - Component score: 95.0/100
  - Current value: 46.4791
  - Position vs EMA50: ABOVE
  - 20-day ROC: +5.98%
  - 50-day ROC: +16.04%

Oil/Gold:
  - Component score: 5.0/100
  - Current value: 0.0128
  - Position vs EMA50: BELOW
  - 20-day ROC: -0.14%
  - 50-day ROC: -15.98%
  → Declining energy demand

SP500/VIX:
  - Component score: 95.0/100
  - Current value: 438.4135
  - Position vs EMA50: ABOVE
  - 20-day ROC: +6.25%
  - 50-day ROC: +9.86%
  → Expanding risk appetite

Commodities/T30y:
  - Component score: 95.0/100
  - Current value: 0.2627
  - Position vs EMA50: ABOVE
  - 20-day ROC: +5.28%
  - 50-day ROC: +4.94%
  → Economic growth expectations

SP500/Nasdaq:
  - Component score: 65.0/100
  - Current value: 0.2951
  - Position vs EMA50: ABOVE
  - 20-day ROC: +0.30%
  - 50-day ROC: +2.66%

============================================================
CONCLUSIONS AND RECOMMENDATIONS
============================================================

The market appears moderately constructive. Some ratios show positive signals,
but elements of caution remain. Monitor developments closely.
Positioning: SELECTIVE, favor quality.


STRONGEST RATIOS:
  • Gold/USD: 95.0/100
  • SP500/VIX: 95.0/100
  • Commodities/T30y: 95.0/100

WEAKEST RATIOS:
  • SP500/Nasdaq: 65.0/100
  • DJ/Gold: 5.0/100
  • Oil/Gold: 5.0/100

============================================================
Analysis automatically generated by kbmeter.com
Date: 2026-01-16
📄 Detailed Asset Allocation Analysis
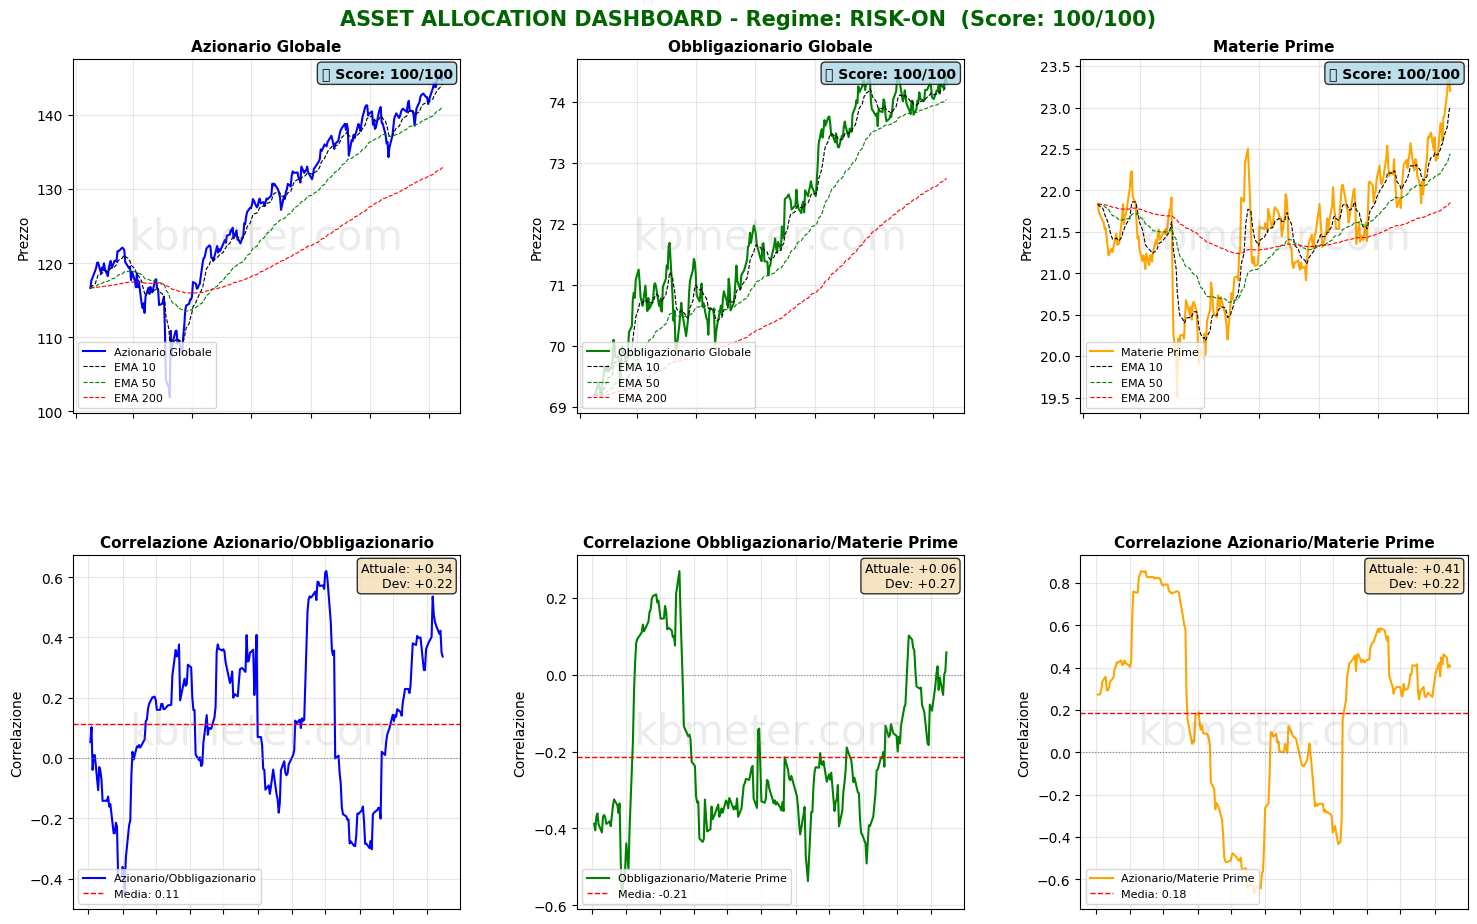
ASSET ALLOCATION & REGIME ANALYSIS - 2026-01-16
======================================================================

MARKET REGIME: RISK-ON
REGIME SCORE: 100.0/100

======================================================================
TREND AND VOLATILITY ANALYSIS
======================================================================

GLOBAL EQUITIES (ACWI):
  Short-Term Trend (5d): +0.17% | ABOVE EMA 10
  Medium-Term Trend (20d): +4.65% | ABOVE EMA 50
  Long-Term Trend (60d): +4.77% | ABOVE EMA 200

  Volatility 5d: 6.5%
  Volatility 20d: 8.5%
  Volatility 60d: 10.7%

COMMODITIES (DBC):
  Medium-Term Trend (20d): +4.95% | ABOVE EMA 50
  Volatility 20d: 14.2%

ACWI/BND Correlation (30d): 0.337

REGIME INTERPRETATION:
The market is in a risk-on regime. Equities show positive trends across multiple
time horizons and volatility remains contained. Investors favor risk assets.
Suggested positioning: OVERWEIGHT equities.

======================================================================
ASSET RANKING - WHICH IS PERFORMING BEST?
======================================================================

🥇 1. Global Equities (ACWI) - SCORE: 100/100
     Price: $145.00
     Trend: ABOVE EMA10 | ABOVE EMA50 | ABOVE EMA200
     Performance: 5d +0.17% | 20d +4.65% | 60d +4.77%
     Volatility: 5d 6.5% | 20d 8.5% | 60d 10.7%
     Drawdown: -0.26%
     → Asset in STRONG HEALTH: positive trends and controlled volatility

🥈 2. Global Bonds (BND) - SCORE: 100/100
     Price: $74.32
     Trend: ABOVE EMA10 | ABOVE EMA50 | ABOVE EMA200
     Performance: 5d +0.04% | 20d +0.44% | 60d -0.02%
     Volatility: 5d 2.6% | 20d 2.4% | 60d 2.9%
     Drawdown: -0.15%
     → Asset in STRONG HEALTH: positive trends and controlled volatility

🥉 3. Commodities (DBC) - SCORE: 100/100
     Price: $23.20
     Trend: ABOVE EMA10 | ABOVE EMA50 | ABOVE EMA200
     Performance: 5d +1.31% | 20d +4.95% | 60d +8.46%
     Volatility: 5d 12.5% | 20d 14.2% | 60d 13.1%
     Drawdown: -0.81%
     → Asset in STRONG HEALTH: positive trends and controlled volatility

======================================================================
CORRELATION ANALYSIS - CURRENT vs HISTORICAL
======================================================================

ACWI/BND:
  Current correlation (30d): +0.337
  Historical average (1 year): +0.112
  Deviation: +0.225
  → Positive correlation: diversification IMPAIRED

BND/DBC:
  Current correlation (30d): +0.059
  Historical average (1 year): -0.214
  Deviation: +0.273

ACWI/DBC:
  Current correlation (30d): +0.406
  Historical average (1 year): +0.184
  Deviation: +0.221

======================================================================
OPERATIONAL SUMMARY
======================================================================

STRONGEST ASSET: Global Equities (Score: 100/100)
WEAKEST ASSET: Commodities (Score: 100/100)

SUGGESTED ACTION: Favor the strongest asset, maintain risk exposure.
DIVERSIFICATION: EXCELLENT - Asset classes are moving independently.

======================================================================
Analysis automatically generated by kbmeter.com
Date: 2026-01-16
On the macro front, the day is set to be particularly quiet, with only Germany’s final December 2025 inflation reading and U.S. industrial production data for last month on the agenda.
As for U.S. earnings, attention today shifts to mid- and small-sized banks such as Regions Financial and PNC.
Already a subscriber? Login here
NOTES AND WARNINGS
Data compiled by kbmeter.com. Analysis date: 16 January 2026 - 8:01 AM GMT+1
This content is provided for informational purposes only and should not be considered financial advice. All scores and assessments are based on the previous trading day’s closing prices. Futures indications refer to the date and time of the analysis.