Financial Markets Remain Cautious as Investors Await January U.S. Jobs Data
The U.S. labor market will be the main focus of today’s financial markets. Investors are awaiting the January 2026 employment report, along with revisions to the figures from previous months. This data, together with next Friday’s inflation reading, will provide guidance on the Fed’s future moves. Overall sentiment remains neutral, and markets still appear to lack a clear direction. Futures point to a positive start for the United States and a weaker one for Europe.
Market Weather Map
February 11, 2026
US Equities
Eu Equities
Asia Equities
Commodities
Bonds
Dollar Index
Technology
Gold
Oil
Crypto
Market Summary
How to interpret our financial indicators? Find out here.
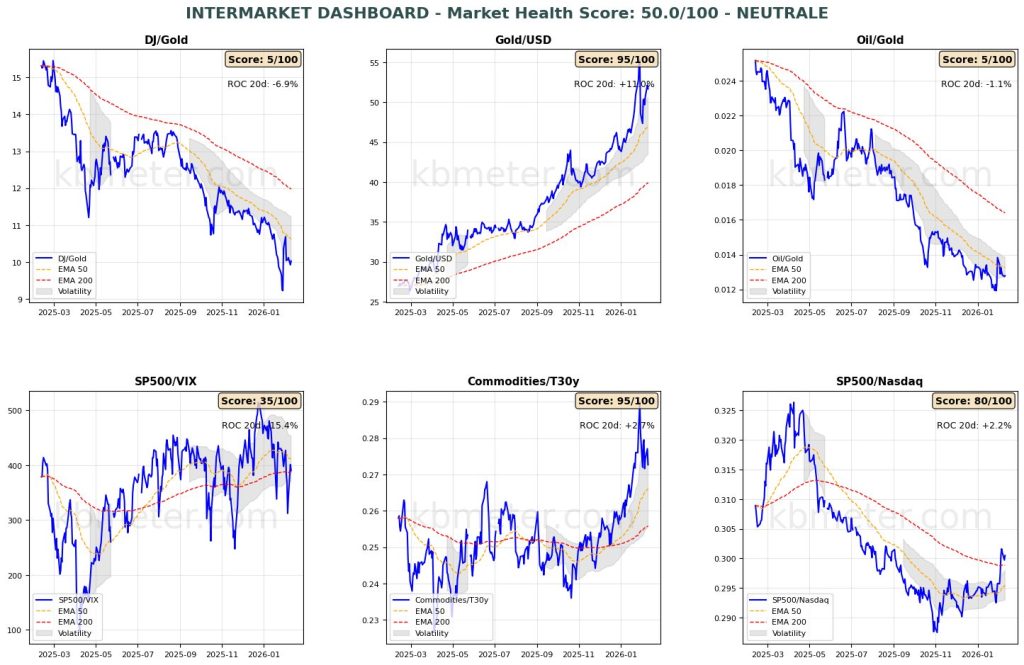
Financial markets today show a neutral to slightly positive sentiment. Intermarket analysis indicates a Market Health Score of 50/100 (neutral). Our intermarket dashboards continue to signal a phase of limited directionality in the markets, with risk indicators still close to their long-term moving average.
Pre-Opening Futures: Global futures signal a moderate risk-on sentiment (average +0.09%), with the U.S. slightly positive (+0.24%), Europe slightly negative (-0.01%), and Asia slightly positive (+0.16%).
📊 Global Futures – Pre-Opening Sentiment
- TecDAX derived: +0.34%
- US Tech 100 derived: +0.29%
- Nikkei 225 derived: +0.24%
- IBEX 35 derived: -0.52%
- FTSE MIB derived: -0.06%
- Euro Stoxx 50 derived: -0.05%
📄 Detailed Intermarket Analysis
INTERMARKET ANALYSIS - 2026-02-11
============================================================

MARKET HEALTH SCORE: 50.0/100
SENTIMENT: NEUTRAL

============================================================
SUMMARY OF KEY RATIOS
============================================================


DJ/Gold:
  - Component score: 5.0/100
  - Current value: 10.0300
  - Position vs EMA50: BELOW
  - 20-day ROC: -6.87%
  - 50-day ROC: -11.91%
  → Flight to safe haven

Gold/USD:
  - Component score: 95.0/100
  - Current value: 51.6921
  - Position vs EMA50: ABOVE
  - 20-day ROC: +10.99%
  - 50-day ROC: +23.61%

Oil/Gold:
  - Component score: 5.0/100
  - Current value: 0.0128
  - Position vs EMA50: BELOW
  - 20-day ROC: -1.09%
  - 50-day ROC: -9.22%
  → Declining energy demand

SP500/VIX:
  - Component score: 35.0/100
  - Current value: 390.2085
  - Position vs EMA50: BELOW
  - 20-day ROC: -15.44%
  - 50-day ROC: -1.54%
  → Contracting risk appetite

Commodities/T30y:
  - Component score: 95.0/100
  - Current value: 0.2727
  - Position vs EMA50: ABOVE
  - 20-day ROC: +2.69%
  - 50-day ROC: +10.99%
  → Economic growth expectations

SP500/Nasdaq:
  - Component score: 80.0/100
  - Current value: 0.3005
  - Position vs EMA50: ABOVE
  - 20-day ROC: +2.21%
  - 50-day ROC: +2.39%
  - ⚠️ ANOMALY DETECTED - Significant deviation from the mean

============================================================
CONCLUSIONS AND RECOMMENDATIONS
============================================================

The market is in a neutral/sideways phase. Conflicting signals across the various ratios.
No clear direction is emerging. Wait for confirmation.
Positioning: BALANCED, avoid extremes.


STRONGEST RATIOS:
  • Gold/USD: 95.0/100
  • Commodities/T30y: 95.0/100
  • SP500/Nasdaq: 80.0/100

WEAKEST RATIOS:
  • SP500/VIX: 35.0/100
  • DJ/Gold: 5.0/100
  • Oil/Gold: 5.0/100

============================================================
Analysis automatically generated by kbmeter.com
Date: 2026-02-11
📄 Detailed Asset Allocation Analysis
ASSET ALLOCATION & REGIME ANALYSIS - 2026-02-11
======================================================================
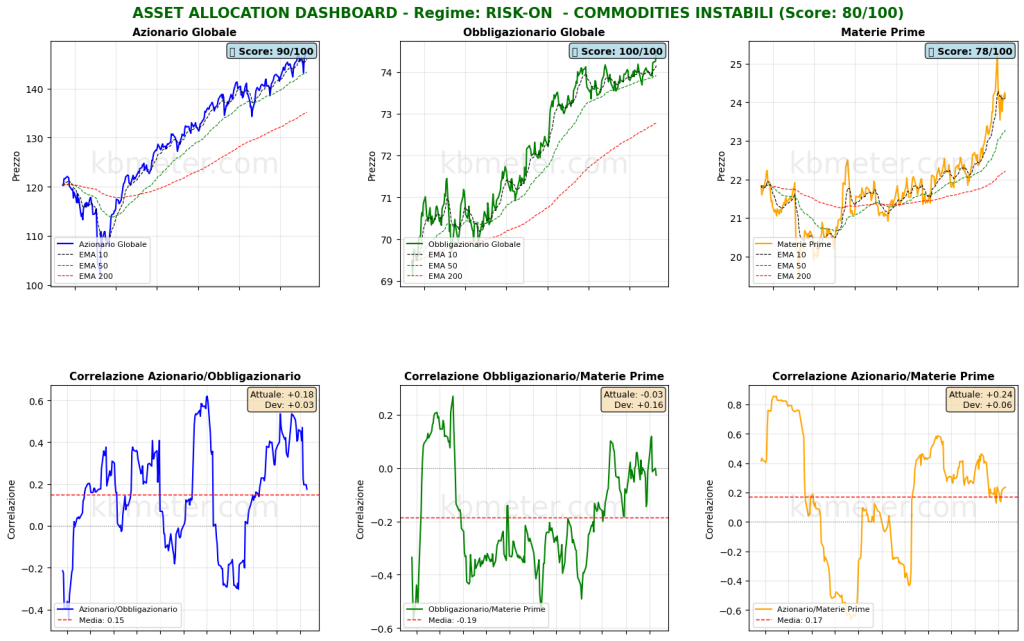
MARKET REGIME: RISK-ON - UNSTABLE COMMODITIES
REGIME SCORE: 80.0/100
======================================================================
TREND AND VOLATILITY ANALYSIS
======================================================================
GLOBAL EQUITIES (ACWI):
Short-Term Trend (5d): +1.60% | ABOVE EMA 10
Medium-Term Trend (20d): +1.67% | ABOVE EMA 50
Long-Term Trend (60d): +6.03% | ABOVE EMA 200
5d Volatility: 20.3%
20d Volatility: 13.7%
60d Volatility: 11.8%
COMMODITIES (DBC):
Medium-Term Trend (20d): +3.29% | ABOVE EMA 50
20d Volatility: 25.8%
ACWI/BND Correlation (30d): 0.175
REGIME INTERPRETATION:
The market is in a risk-on regime. Equities show positive trends across multiple
time horizons and volatility remains contained. Investors favor risk assets.
Suggested positioning: OVERWEIGHT equities.
⚠️ COMMODITIES ALERT: Commodities are showing elevated volatility. This may
indicate uncertainty regarding economic growth or unstable supply/demand dynamics.
======================================================================
ASSET RANKING - WHO IS PERFORMING BEST?
======================================================================
🥇 1. Global Bonds (BND) - SCORE: 100/100
Price: $74.47
Trend: ABOVE EMA10 | ABOVE EMA50 | ABOVE EMA200
Performance: 5d +0.77% | 20d +0.59% | 60d +1.26%
Volatility: 5d 3.3% | 20d 2.9% | 60d 2.8%
Drawdown: 0.00%
→ Asset in STRONG HEALTH: positive trends and controlled volatility
🥈 2. Global Equities (ACWI) - SCORE: 90/100
Price: $147.31
Trend: ABOVE EMA10 | ABOVE EMA50 | ABOVE EMA200
Performance: 5d +1.60% | 20d +1.67% | 60d +6.03%
Volatility: 5d 20.3% | 20d 13.7% | 60d 11.8%
Drawdown: -0.07%
→ Asset in STRONG HEALTH: positive trends and controlled volatility
🥉 3. Commodities (DBC) - SCORE: 78/100
Price: $24.14
Trend: ABOVE EMA10 | ABOVE EMA50 | ABOVE EMA200
Performance: 5d -0.21% | 20d +3.29% | 60d +8.87%
Volatility: 5d 18.6% | 20d 25.8% | 60d 18.2%
Drawdown: -4.58%
→ Asset in STRONG HEALTH: positive trends and controlled volatility
======================================================================
CORRELATION ANALYSIS - CURRENT vs HISTORICAL
======================================================================
ACWI/BND:
Current correlation (30d): +0.175
Historical average (1 year): +0.149
Deviation: +0.026
→ Weak correlation: moderate diversification
BND/DBC:
Current correlation (30d): -0.026
Historical average (1 year): -0.186
Deviation: +0.160
ACWI/DBC:
Current correlation (30d): +0.236
Historical average (1 year): +0.174
Deviation: +0.063
======================================================================
OPERATIONAL SUMMARY
======================================================================
STRONGEST ASSET: Global Bonds (Score: 100/100)
WEAKEST ASSET: Commodities (Score: 78/100)
SUGGESTED ACTION: Favor the strongest asset, maintain risk exposure.
DIVERSIFICATION: EXCELLENT - Asset classes are moving independently.
======================================================================
Analysis automatically generated by kbmeter.com
Date: 2026-02-11
The macro focus of the day revolves around U.S. labor market data, which will be released together with revisions to previous months’ figures. China’s inflation data is also worth noting.
On the earnings front, today’s schedule includes, among others, results from McDonald’s, Kraft Heinz, and Cisco.
Already a subscriber? Login here
NOTES AND WARNINGS
Analysis automatically generated by kbmeter.com. Analysis date: 11 February 2026 - 7:23 AM GMT+1
This content is provided for informational purposes only and should not be considered financial advice. All scores and assessments are based on the previous trading day’s closing prices. Futures indications refer to the date and time of the analysis.