Financial Markets on Hold, Neutral Sentiment as Investors Await Middle East Developments
Financial markets are holding their breath as the deadline of the U.S. ultimatum to Iran approaches. Investor sentiment remains neutral, slightly supported by the modest rebound seen in recent days. Expectations appear tilted toward very cautious optimism; however, oil prices continue to surge, and futures indicate a weak opening outlook for both Europe and the United States.
Market Weather Map
April 7, 2026
US Equities
Eu Equities
Asia Equities
Commodities
Bonds
Dollar Index
Technology
Gold
Oil
Crypto
Market Summary
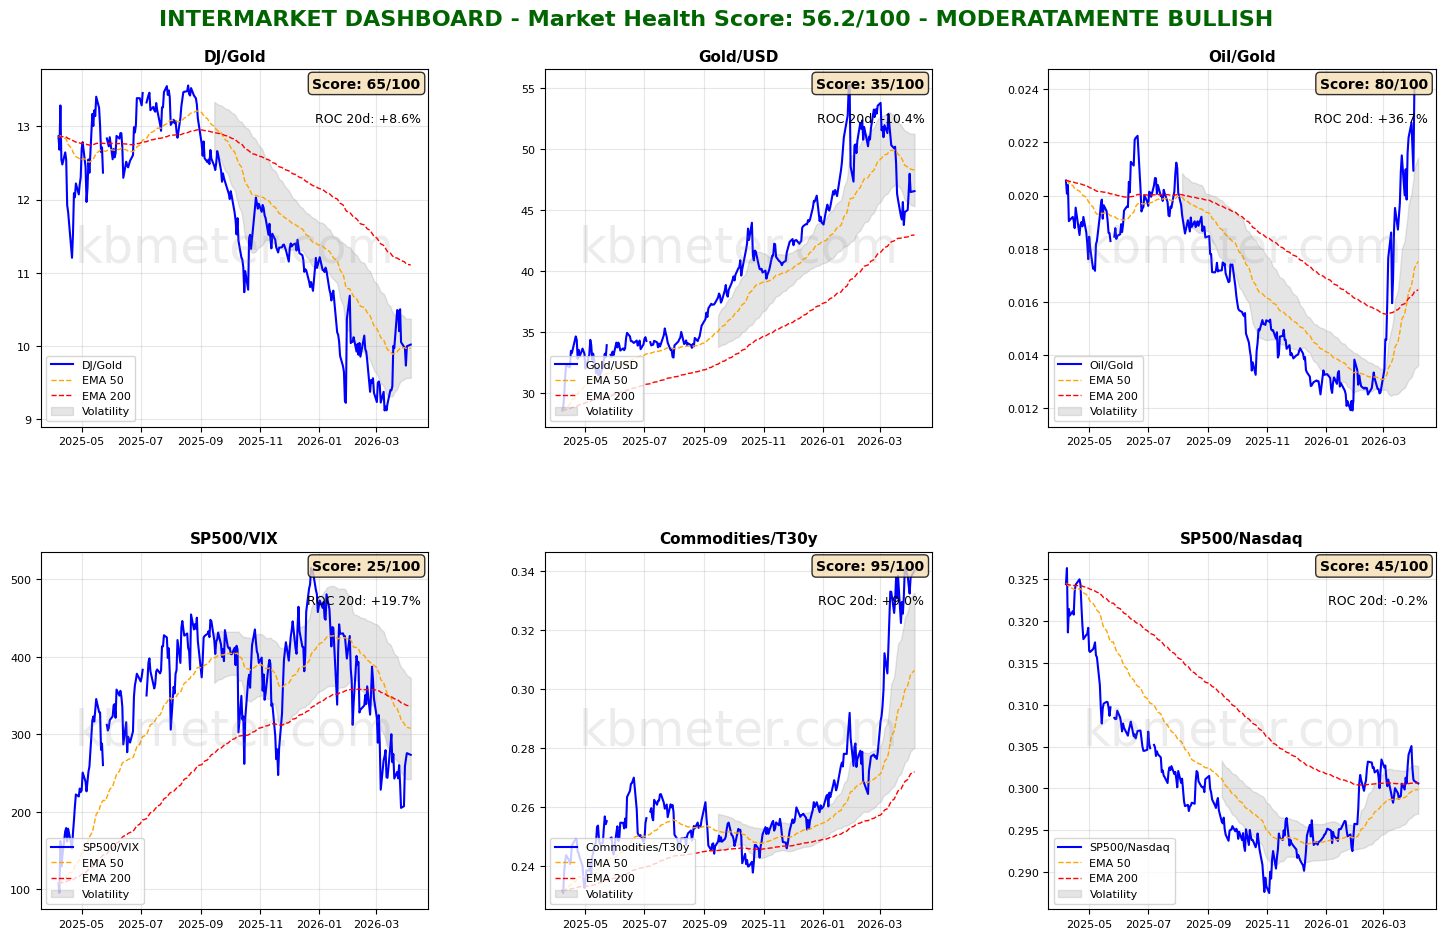
Financial markets are currently displaying a neutral sentiment. Intermarket analysis shows a Market Health Score of 56/100 (neutral). Our intermarket dashboards confirm a situation of “stable uncertainty,” with limited significant movement in risk appetite indicators.
We observe a marked increase in volatility in the Oil/Gold and Commodities/Long-Term Treasury ratios. This reflects rising tension among investors as the deadline of Trump’s ultimatum to Iran draws closer—an accumulation of pressure that, for now, has pushed both global equities and bonds away from their long-term moving averages and reduced the slope of the fast-moving average for commodities.
Pre-Opening Futures: Global futures point to a moderate risk-off sentiment (average -0.29%), with the U.S. slightly negative (-0.43%), Europe slightly negative (-0.12%), and Asia more decisively negative (-0.61%).
📊 Global Futures – Pre-Open Sentiment
- FTSE 100 derived: +0.24%
- Euro Stoxx 50 derived: +0.14%
- DAX derived: +0.11%
- Nikkei 225 derived: -1.05%
- TecDAX derived: -0.68%
- Russell 2000: -0.65%
📄 Detailed Intermarket Analysis
INTERMARKET ANALYSIS - 2026-04-07
============================================================

MARKET HEALTH SCORE: 56.2/100
SENTIMENT: MODERATELY BULLISH

============================================================
SUMMARY OF MAIN RATIOS
============================================================


DJ/Gold:
  - Component score: 65.0/100
  - Current value: 10.0219
  - Position vs EMA50: ABOVE
  - 20-day ROC: +8.57%
  - 50-day ROC: -0.38%
  → Preference for risk assets vs safe haven

Gold/USD:
  - Component score: 35.0/100
  - Current value: 46.5773
  - Position vs EMA50: BELOW
  - 20-day ROC: -10.40%
  - 50-day ROC: -6.67%

Oil/Gold:
  - Component score: 80.0/100
  - Current value: 0.0241
  - Position vs EMA50: ABOVE
  - 20-day ROC: +36.66%
  - 50-day ROC: +99.62%
  - ⚠️ ANOMALY DETECTED - Significant deviation from the average
  → Rising energy demand

SP500/VIX:
  - Component score: 25.0/100
  - Current value: 273.5552
  - Position vs EMA50: BELOW
  - 20-day ROC: +19.69%
  - 50-day ROC: -38.11%

Commodities/T30y:
  - Component score: 95.0/100
  - Current value: 0.3402
  - Position vs EMA50: ABOVE
  - 20-day ROC: +8.96%
  - 50-day ROC: +24.28%
  → Economic growth expectations

SP500/Nasdaq:
  - Component score: 45.0/100
  - Current value: 0.3006
  - Position vs EMA50: ABOVE
  - 20-day ROC: -0.16%
  - 50-day ROC: +1.90%

============================================================
CONCLUSIONS AND RECOMMENDATIONS
============================================================

The market is moderately constructive. Some ratios show positive signals,
but elements of caution remain. Monitor developments.
Positioning: SELECTIVE, favor quality.


STRONGEST RATIOS:
  • Commodities/T30y: 95.0/100
  • Oil/Gold: 80.0/100
  • DJ/Gold: 65.0/100

WEAKEST RATIOS:
  • SP500/Nasdaq: 45.0/100
  • Gold/USD: 35.0/100
  • SP500/VIX: 25.0/100

============================================================
Analysis automatically generated by kbmeter.com
Date: 2026-04-07
📄 Detailed Asset Allocation Analysis
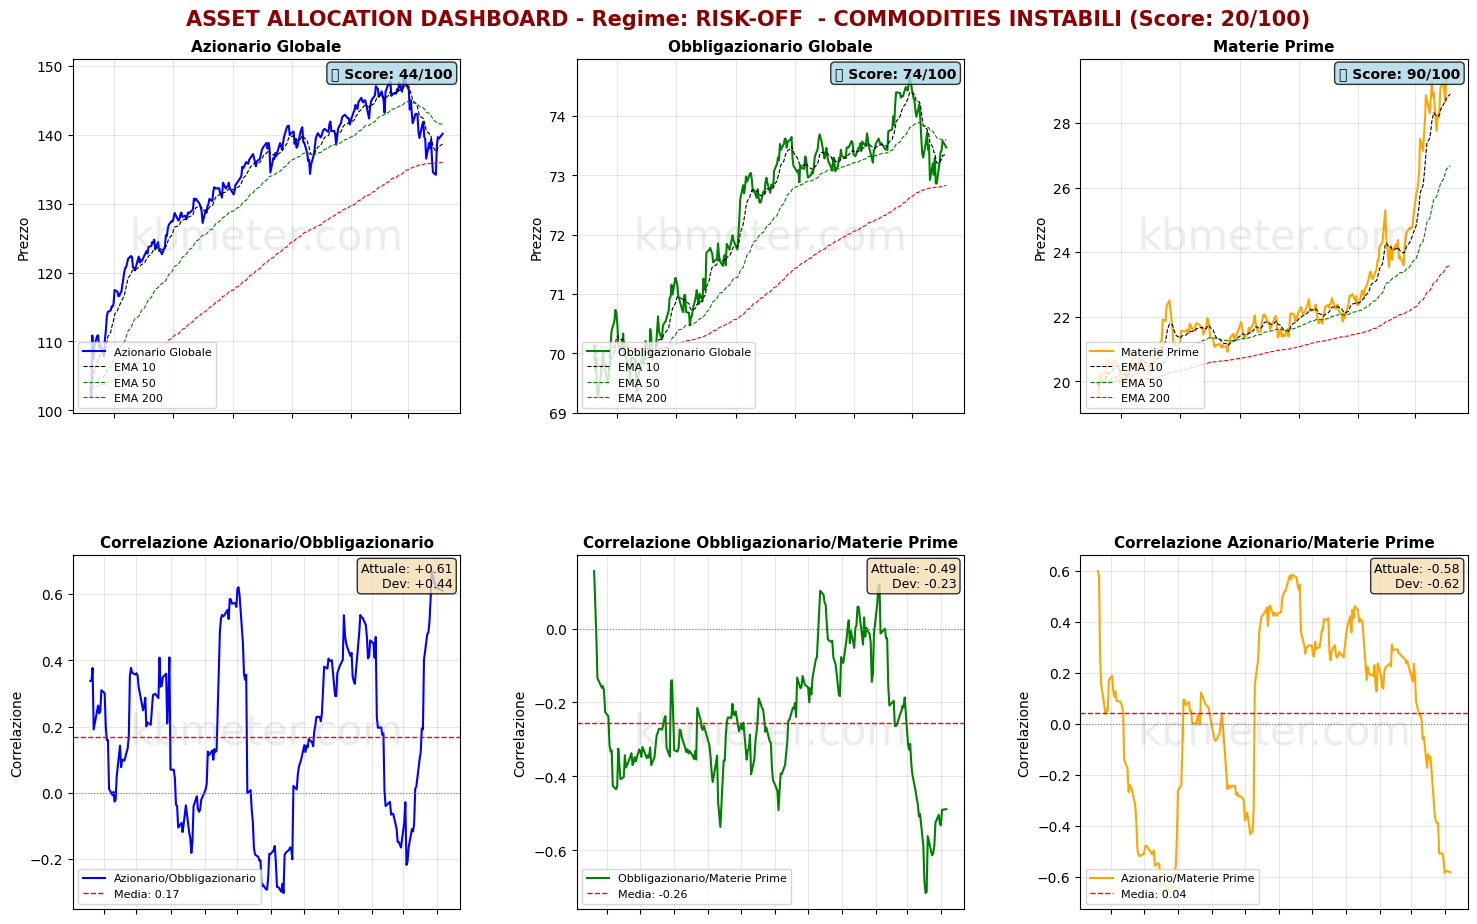
ASSET ALLOCATION & REGIME ANALYSIS - 2026-04-07
======================================================================

MARKET REGIME: RISK-OFF - UNSTABLE COMMODITIES
REGIME SCORE: 20.0/100

======================================================================
TREND AND VOLATILITY ANALYSIS
======================================================================

GLOBAL EQUITIES (ACWI):
  Short-Term Trend (5d): +4.44% | ABOVE EMA 10
  Medium-Term Trend (20d): -2.03% | BELOW EMA 50
  Long-Term Trend (60d): -2.52% | ABOVE EMA 200

  5d Volatility: 21.8%
  20d Volatility: 21.3%
  60d Volatility: 16.3%

COMMODITIES (DBC):
  Medium-Term Trend (20d): +8.62% | ABOVE EMA 50
  20d Volatility: 27.4%

ACWI/BND Correlation (30d): 0.610

REGIME INTERPRETATION:
The market is in a risk-off regime. Negative trends across multiple horizons and/or elevated
volatility. Flight to safe assets.
Suggested positioning: DEFENSIVE, capital preservation.

⚠️ COMMODITIES ALERT: Commodities are showing elevated volatility. This may
indicate uncertainty about economic growth or unstable supply/demand dynamics.

======================================================================
ASSET RANKING - WHO IS PERFORMING BEST?
======================================================================

🥇 1. Commodities (DBC) - SCORE: 90/100
     Price: $29.48
     Trend: ABOVE EMA10 | ABOVE EMA50 | ABOVE EMA200
     Performance: 5d +0.75% | 20d +8.62% | 60d +28.85%
     Volatility: 5d 21.5% | 20d 27.4% | 60d 24.9%
     Drawdown: 0.00%
     → Asset in STRONG HEALTH: positive trends and controlled volatility

🥈 2. Global Bonds (BND) - SCORE: 74/100
     Price: $73.47
     Trend: ABOVE EMA10 | BELOW EMA50 | ABOVE EMA200
     Performance: 5d +0.33% | 20d -0.98% | 60d +0.08%
     Volatility: 5d 3.9% | 20d 5.8% | 60d 4.1%
     Drawdown: -1.63%
     → Asset in STRONG HEALTH: positive trends and controlled volatility

🥉 3. Global Equities (ACWI) - SCORE: 44/100
     Price: $140.15
     Trend: ABOVE EMA10 | BELOW EMA50 | ABOVE EMA200
     Performance: 5d +4.44% | 20d -2.03% | 60d -2.52%
     Volatility: 5d 21.8% | 20d 21.3% | 60d 16.3%
     Drawdown: -5.72%
     → Asset in WEAK conditions: negative trends or elevated volatility

======================================================================
CORRELATION ANALYSIS - CURRENT vs HISTORICAL
======================================================================

ACWI/BND:
  Current Correlation (30d): +0.610
  Historical Average (1 year): +0.170
  Deviation: +0.440
  ⚠️ SIGNIFICANT DEVIATION from historical average
  → Positive correlation: diversification COMPROMISED

BND/DBC:
  Current Correlation (30d): -0.489
  Historical Average (1 year): -0.257
  Deviation: -0.232

ACWI/DBC:
  Current Correlation (30d): -0.583
  Historical Average (1 year): +0.042
  Deviation: -0.624
  ⚠️ SIGNIFICANT DEVIATION from historical average
  → Negative correlation: possible supply-driven shift

======================================================================
OPERATIONAL SUMMARY
======================================================================

STRONGEST ASSET: Commodities (Score: 90/100)
WEAKEST ASSET: Global Equities (Score: 44/100)

SUGGESTED ACTION: Reduce exposure to the weakest asset, favor defensive positioning.
DIVERSIFICATION: GOOD - diversification benefits present.

======================================================================
Analysis automatically generated by kbmeter.com
Date: 2026-04-07
On the macro front, the day will feature the final readings of March composite PMIs, U.S. durable goods orders data for February, and the Federal Reserve’s March survey on consumer inflation expectations.
Already a subscriber? Login here
NOTES AND WARNINGS
Data compiled by kbmeter.com. Analysis date: 7 April 2026 - 7:51 AM GMT+1
This content is provided for informational purposes only and should not be considered financial advice. All scores and assessments are based on the previous trading day’s closing prices. Futures indications refer to the date and time of the analysis.