Financial Markets Remain on Edge Amid Middle East Dialogue Efforts; Inflation Expectations Weigh on Bonds
Financial markets remain tense, while the conflict in the Middle East continues to highlight the difficulties in establishing a basis for dialogue between the parties. Investors maintain a sentiment ranging from neutral to moderately negative, with inflation risk clearly emerging from the weakness in the bond sector. Futures indicate a weak opening for both Europe and the United States.
Market Weather Map
March 26, 2026
US Equities
Eu Equities
Asia Equities
Commodities
Bonds
Dollar Index
Technology
Gold
Oil
Crypto
Market Summary
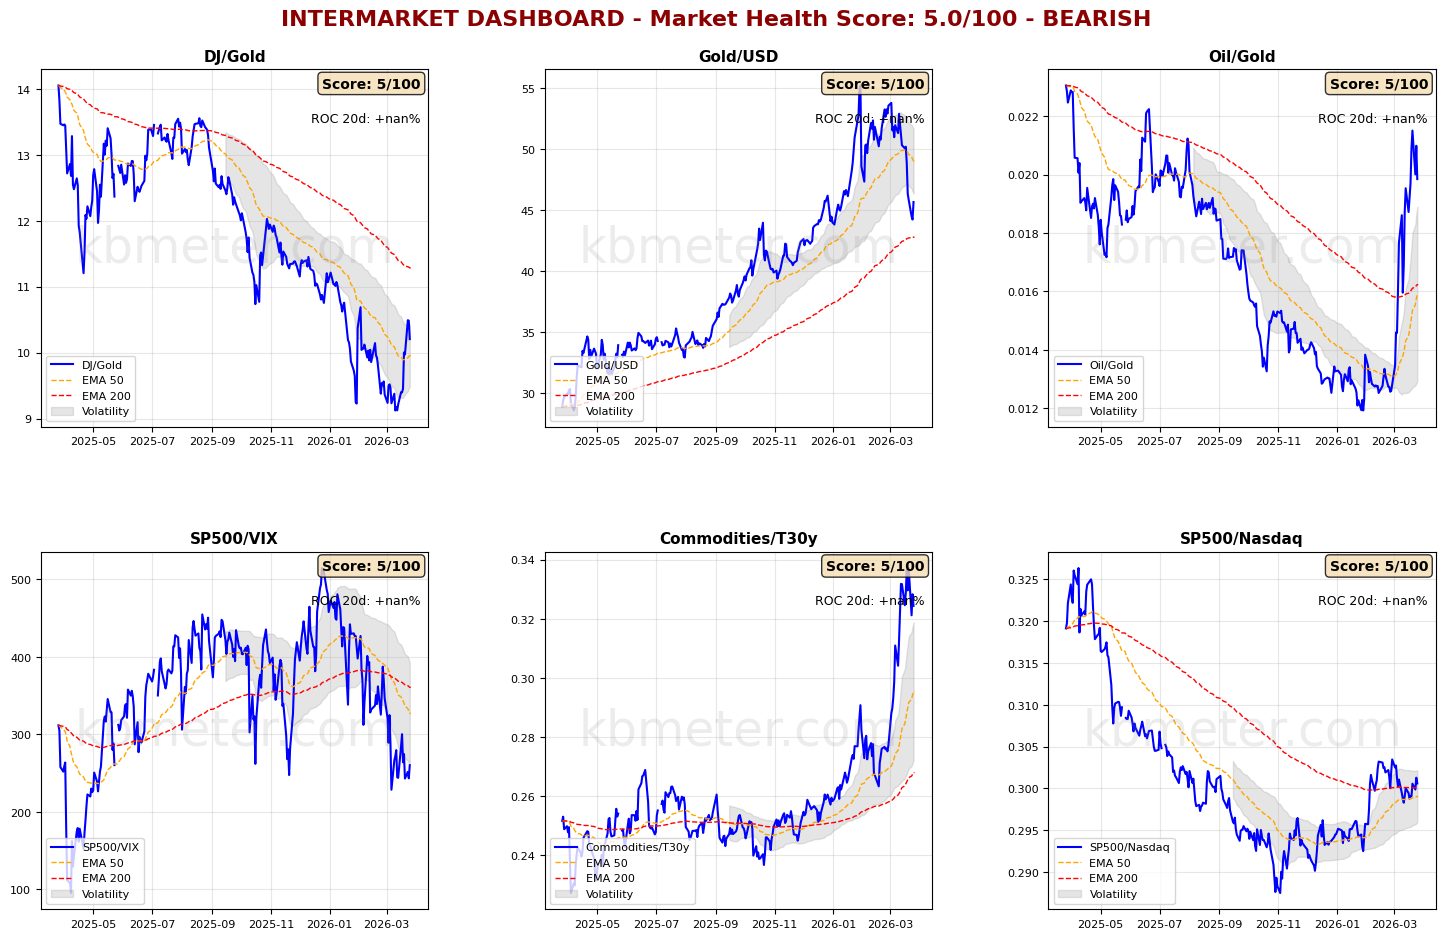
Financial markets are currently showing a neutral to moderately negative sentiment. Intermarket analysis highlights a Market Health Score of 5/100 (negative). Our intermarket dashboards continue to reflect a compressed environment. Risk appetite indicators have stabilized in a risk-off zone, while oil prices are retreating from recent highs and gold is experiencing a slight recovery.
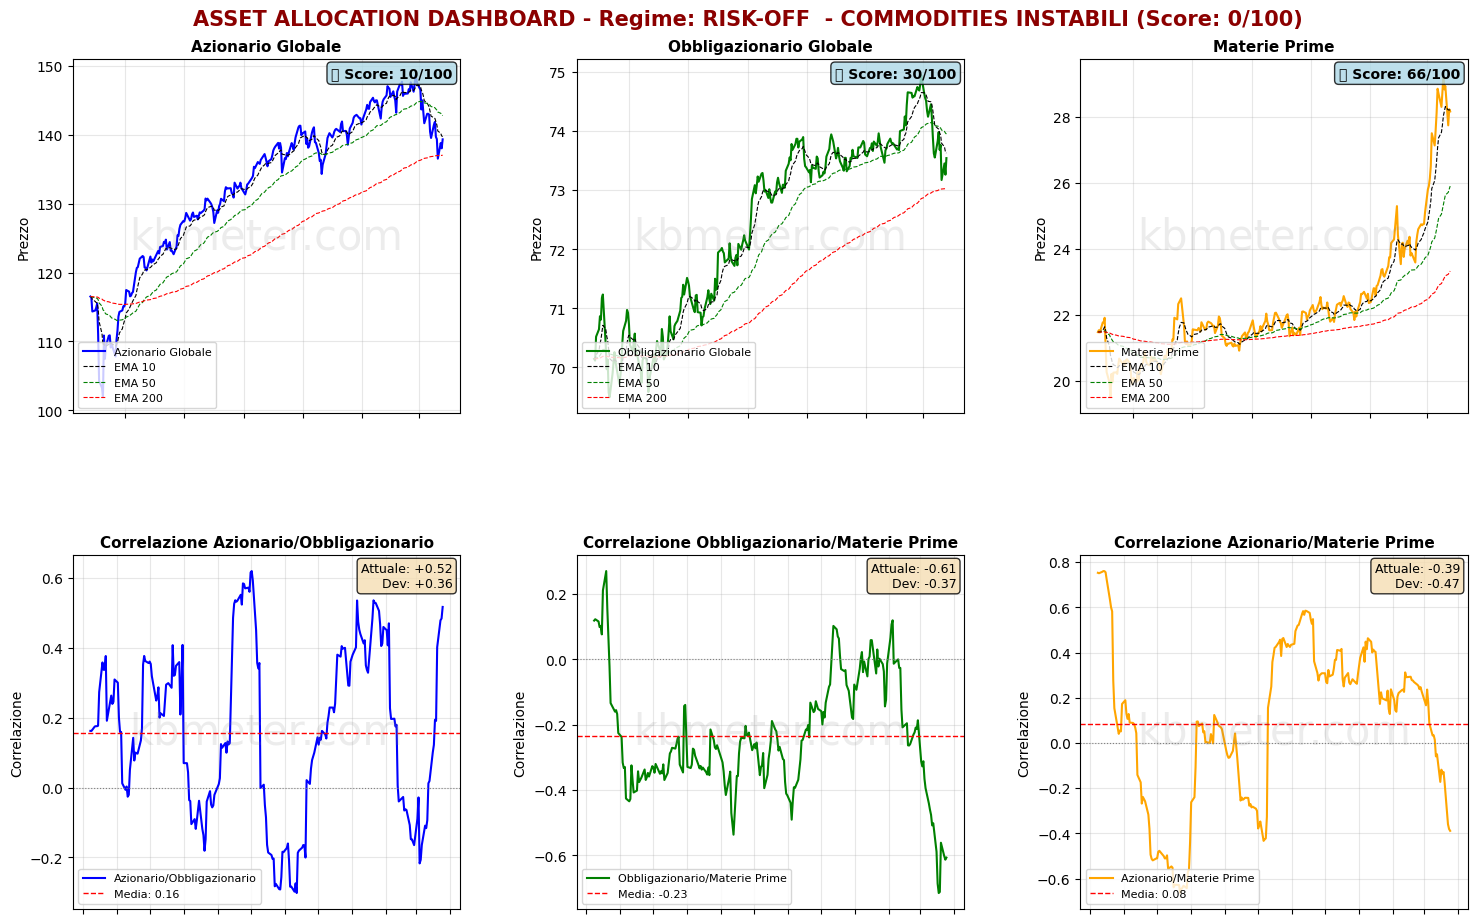
The most interesting aspect concerns the analysis of asset classes. Starting from our “weather map,” we observe that none of the monitored elements have scores above 50 points, and inflation expectations are significantly weighing on bonds. For the time being, the 200-day moving average continues to provide support, but if negative news from the Middle East were to emerge, the resilience of this support could become problematic—for both bonds and global equities.
Pre-Opening Futures: Global futures signal a moderate risk-off sentiment (average -0.11%), with the US slightly negative (-0.50%), Europe slightly positive (+0.16%), and Asia slightly negative (-0.38%).
📊 Global Futures – Pre-Opening Sentiment
- TecDAX derived: +2.55%
- CSI 300: +1.57%
- FTSE MIB derived: +1.46%
- Hang Seng derived: -1.81%
- DAX derived: -0.96%
- Mini DAX: -0.94%
📄 Detailed Intermarket Analysis
INTERMARKET ANALYSIS - 2026-03-26
============================================================

MARKET HEALTH SCORE: 5.0/100
SENTIMENT: BEARISH

============================================================
MAIN RATIOS SUMMARY
============================================================


DJ/Gold:
  - Component score: 5.0/100
  - Current value: nan
  - Position vs EMA50: BELOW
  - 20-day ROC: +nan%
  - 50-day ROC: +nan%
  → Flight to safe haven

Gold/USD:
  - Component score: 5.0/100
  - Current value: nan
  - Position vs EMA50: BELOW
  - 20-day ROC: +nan%
  - 50-day ROC: +nan%

Oil/Gold:
  - Component score: 5.0/100
  - Current value: nan
  - Position vs EMA50: BELOW
  - 20-day ROC: +nan%
  - 50-day ROC: +nan%
  → Declining energy demand

SP500/VIX:
  - Component score: 5.0/100
  - Current value: nan
  - Position vs EMA50: BELOW
  - 20-day ROC: +nan%
  - 50-day ROC: +nan%

Commodities/T30y:
  - Component score: 5.0/100
  - Current value: nan
  - Position vs EMA50: BELOW
  - 20-day ROC: +nan%
  - 50-day ROC: +nan%
  → Slowdown expectations

SP500/Nasdaq:
  - Component score: 5.0/100
  - Current value: nan
  - Position vs EMA50: BELOW
  - 20-day ROC: +nan%
  - 50-day ROC: +nan%

============================================================
CONCLUSIONS AND RECOMMENDATIONS
============================================================

The market is in bearish territory. Signs of widespread stress.
Risk-off behavior is underway. Maximum caution advised.
Positioning: VERY DEFENSIVE, capital preservation.


STRONGEST RATIOS:
  • DJ/Gold: 5.0/100
  • Gold/USD: 5.0/100
  • Oil/Gold: 5.0/100

WEAKEST RATIOS:
  • SP500/VIX: 5.0/100
  • Commodities/T30y: 5.0/100
  • SP500/Nasdaq: 5.0/100

============================================================
Analysis automatically generated by kbmeter.com
Date: 2026-03-26
📄 Detailed Asset Allocation Analysis
ASSET ALLOCATION & REGIME ANALYSIS - 2026-03-26
======================================================================

MARKET REGIME: RISK-OFF - UNSTABLE COMMODITIES
REGIME SCORE: 0.0/100

======================================================================
TREND AND VOLATILITY ANALYSIS
======================================================================

GLOBAL EQUITIES (ACWI):
  Short-Term Trend (5d): -0.03% | BELOW EMA 10
  Medium-Term Trend (20d): -5.82% | BELOW EMA 50
  Long-Term Trend (60d): -2.16% | ABOVE EMA 200

  Volatility 5d: 22.7%
  Volatility 20d: 17.4%
  Volatility 60d: 14.2%

COMMODITIES (DBC):
  Medium-Term Trend (20d): +13.77% | ABOVE EMA 50
  Volatility 20d: 29.0%

Correlation ACWI/BND (30d): 0.517

REGIME INTERPRETATION:
The market is in a risk-off regime. Negative trends across multiple horizons and/or
elevated volatility. Flight to safe assets.
Suggested positioning: DEFENSIVE, capital protection.

⚠️ COMMODITIES ALERT: Commodities are showing high volatility. This may
indicate uncertainty about economic growth or unstable supply/demand dynamics.

======================================================================
ASSET RANKING - WHO IS PERFORMING BEST?
======================================================================

🥇 1. Commodities (DBC) - SCORE: 66/100
     Price: $28.17
     Trend: BELOW EMA10 | ABOVE EMA50 | ABOVE EMA200
     Performance: 5d -2.32% | 20d +13.77% | 60d +25.26%
     Volatility: 5d 35.1% | 20d 29.0% | 60d 24.6%
     Drawdown: -3.76%
     → Asset in FAIR condition: predominantly positive signals

🥈 2. Global Bonds (BND) - SCORE: 30/100
     Price: $73.54
     Trend: BELOW EMA10 | BELOW EMA50 | ABOVE EMA200
     Performance: 5d -0.30% | 20d -1.67% | 60d -0.39%
     Volatility: 5d 8.0% | 20d 5.2% | 60d 3.8%
     Drawdown: -1.87%
     → Asset in WEAK condition: negative trends or elevated volatility

🥉 3. Global Equities (ACWI) - SCORE: 10/100
     Price: $139.34
     Trend: BELOW EMA10 | BELOW EMA50 | ABOVE EMA200
     Performance: 5d -0.03% | 20d -5.82% | 60d -2.16%
     Volatility: 5d 22.7% | 20d 17.4% | 60d 14.2%
     Drawdown: -6.26%
     → Asset in DISTRESS: avoid or significantly underweight

======================================================================
CORRELATION ANALYSIS - CURRENT vs HISTORICAL
======================================================================

ACWI/BND:
  Current correlation (30d): +0.517
  Historical average (1 year): +0.157
  Deviation: +0.361
  ⚠️ SIGNIFICANT DEVIATION from historical average
  → Positive correlation: diversification COMPROMISED

BND/DBC:
  Current correlation (30d): -0.607
  Historical average (1 year): -0.234
  Deviation: -0.373
  ⚠️ SIGNIFICANT DEVIATION from historical average

ACWI/DBC:
  Current correlation (30d): -0.389
  Historical average (1 year): +0.085
  Deviation: -0.474
  ⚠️ SIGNIFICANT DEVIATION from historical average
  → Negative correlation: possible supply-driven shift

======================================================================
OPERATIONAL SUMMARY
======================================================================

STRONGEST ASSET: Commodities (Score: 66/100)
WEAKEST ASSET: Global Equities (Score: 10/100)

SUGGESTED ACTION: Reduce exposure to the weakest asset, favor defensive positions.
DIVERSIFICATION: GOOD - diversification benefits present.

======================================================================
Analysis automatically generated by kbmeter.com
Date: 2026-03-26
On the macro front, the day does not present major catalysts. Noteworthy are the German consumer confidence data at the end of March, French private sector data (also at the end of March), and US jobless claims figures.
Already a subscriber? Login here
NOTES AND WARNINGS
Data compiled by kbmeter.com. Analysis date: 26 March 2026 - 7:47 AM GMT+1
This content is provided for informational purposes only and should not be considered financial advice. All scores and assessments are based on the previous trading day’s closing prices. Futures indications refer to the date and time of the analysis.