Financial Markets: Momentum Eases Into Week’s End, Sentiment Remains Moderately Positive
Financial markets are heading toward the end of a week largely characterized by optimism over the possibility that an agreement in the Middle East may ultimately be reached, along with reassuring signals on both the macroeconomic and earnings fronts. However, the final part of the week is showing a slight slowdown in momentum, with sentiment remaining moderately positive and volatility still elevated, albeit declining.
The impression is that investors have largely priced in a potential US–Iran agreement, but are still unable to fully assess the effects that 50 days of conflict may have on economic performance in the coming months. This explains the wait-and-see attitude that is likely to characterize the final trading session of the week. Futures point to a flat opening for both Europe and the United States.
Market Weather Map
April 17, 2026
US Equities
Eu Equities
Asia Equities
Commodities
Bonds
Dollar Index
Technology
Gold
Oil
Crypto
Market Summary
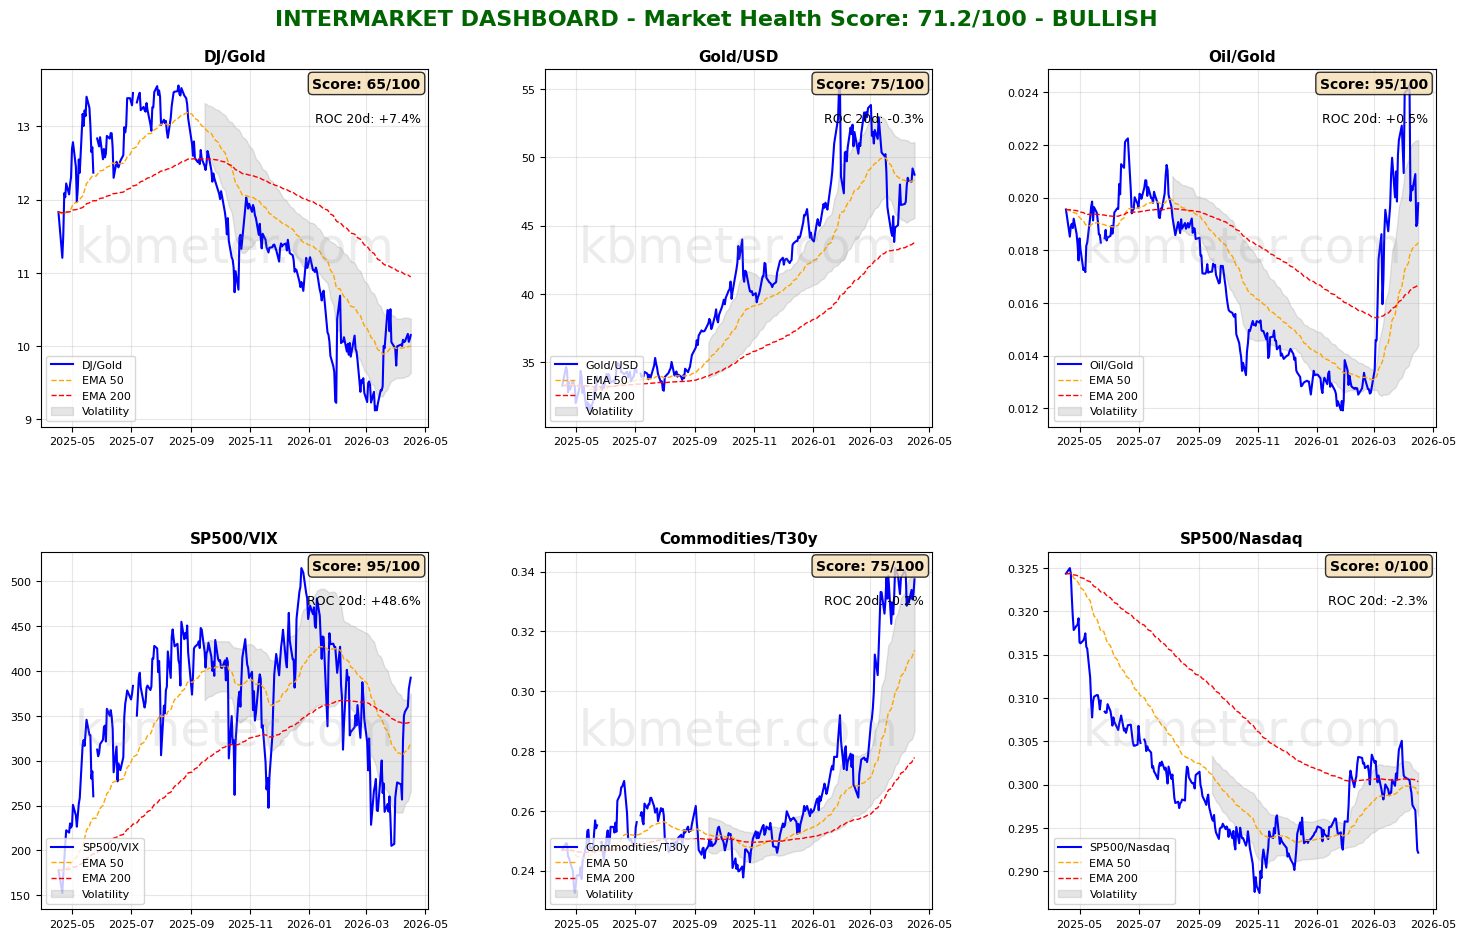
Financial markets currently display a moderately positive sentiment. Intermarket analysis shows a Market Health Score of 71/100 (positive). Our intermarket dashboards confirm the signals observed in the previous analysis, with risk appetite indicators losing momentum after the rapid rebound. Across asset classes, there is also evidence of fading momentum in the rebound that had involved both global equities and bonds.
Our market “weather map” signals equities slipping back below the 60 threshold, within a context of stabilization further confirmed by a narrowing valuation range.
Pre-market futures: Global futures indicate a moderately risk-off sentiment (average -0.08%), with the US slightly positive (+0.02%), Europe slightly negative (-0.09%), and Asia slightly negative (-0.20%).
📊 Global Futures – Pre-Market Sentiment
- CSI 300: +0.62%
- TecDAX derived: +0.54%
- Dow Jones: +0.13%
- IBEX 35 derived: -0.77%
- Hang Seng derived: -0.70%
- Nikkei 225 derived: -0.52%
📄 Detailed Intermarket Analysis
INTERMARKET ANALYSIS - 2026-04-17
============================================================

MARKET HEALTH SCORE: 71.2/100
SENTIMENT: BULLISH

============================================================
SUMMARY OF KEY RATIOS
============================================================


DJ/Gold:
  - Component score: 65.0/100
  - Current value: 10.1514
  - Position vs EMA50: ABOVE
  - 20-day ROC: +7.39%
  - 50-day ROC: +1.09%
  → Preference for risky assets vs safe havens

Gold/USD:
  - Component score: 75.0/100
  - Current value: 48.7212
  - Position vs EMA50: ABOVE
  - 20-day ROC: -0.27%
  - 50-day ROC: -3.19%

Oil/Gold:
  - Component score: 95.0/100
  - Current value: 0.0198
  - Position vs EMA50: ABOVE
  - 20-day ROC: +0.45%
  - 50-day ROC: +53.51%
  → Rising energy demand

SP500/VIX:
  - Component score: 95.0/100
  - Current value: 392.4905
  - Position vs EMA50: ABOVE
  - 20-day ROC: +48.65%
  - 50-day ROC: +2.13%
  → Expanding risk appetite

Commodities/T30y:
  - Component score: 75.0/100
  - Current value: 0.3374
  - Position vs EMA50: ABOVE
  - 20-day ROC: -0.16%
  - 50-day ROC: +20.33%
  → Economic growth expectations

SP500/Nasdaq:
  - Component score: 0.0/100
  - Current value: 0.2921
  - Position vs EMA50: BELOW
  - 20-day ROC: -2.31%
  - 50-day ROC: -1.79%
  - ⚠️ ANOMALY DETECTED - Significant deviation from the average

============================================================
CONCLUSIONS AND RECOMMENDATIONS
============================================================

The market shows broad-based strength signals. Intermarket ratios suggest
a risk-friendly environment. High risk appetite and positive trends.
Positioning: CONSTRUCTIVE on risky assets.


STRONGEST RATIOS:
  • Oil/Gold: 95.0/100
  • SP500/VIX: 95.0/100
  • Gold/USD: 75.0/100

WEAKEST RATIOS:
  • Commodities/T30y: 75.0/100
  • DJ/Gold: 65.0/100
  • SP500/Nasdaq: 0.0/100

============================================================
Analysis automatically generated by kbmeter.com
Date: 2026-04-17
📄 Detailed Asset Allocation Analysis
ASSET ALLOCATION & REGIME ANALYSIS - 2026-04-17
======================================================================
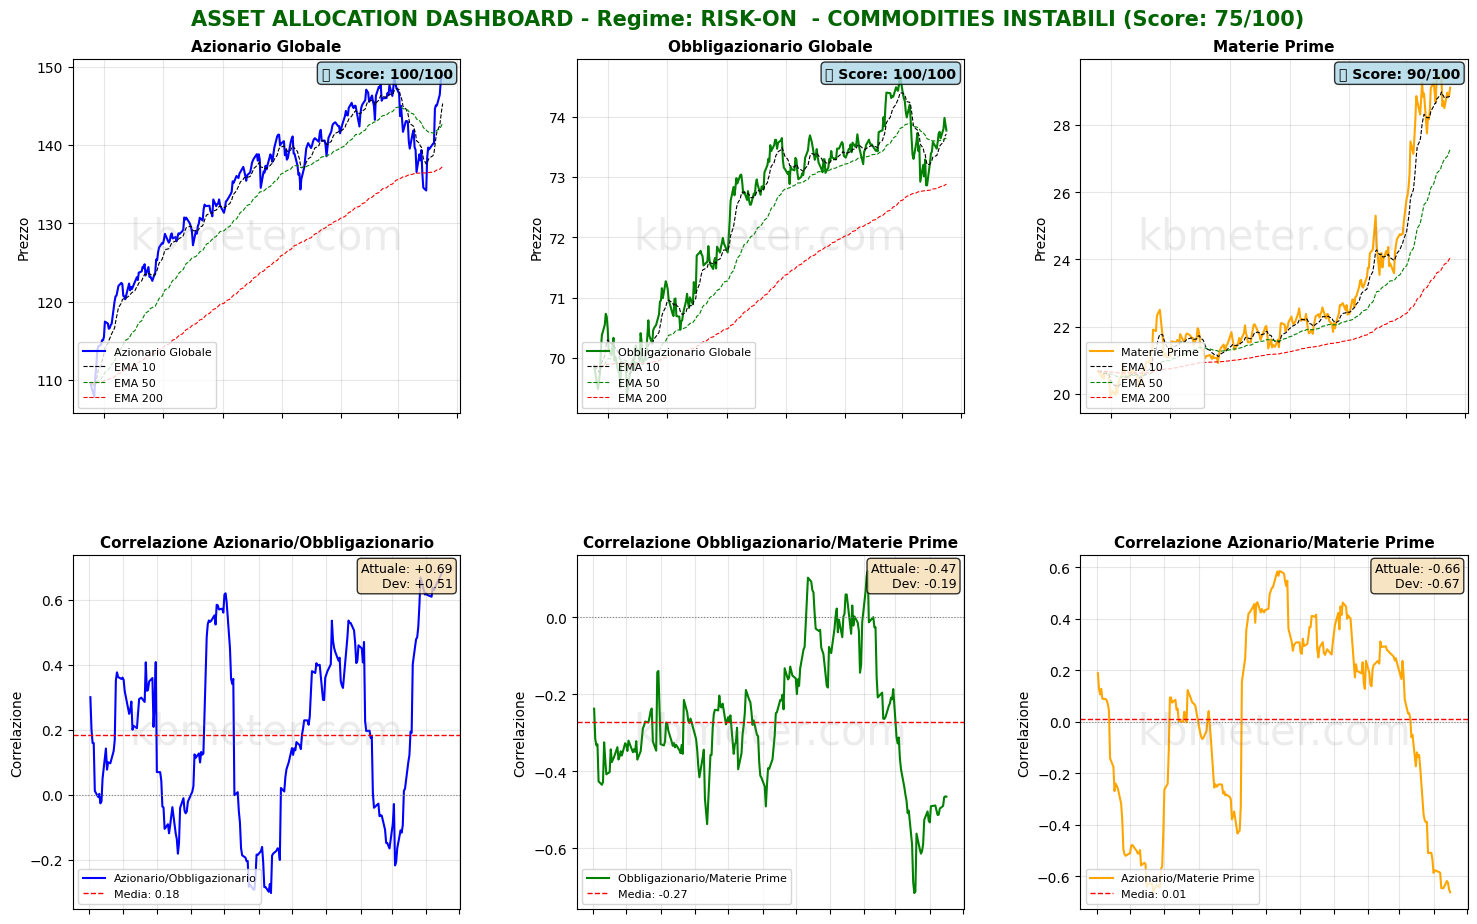
MARKET REGIME: RISK-ON - UNSTABLE COMMODITIES
REGIME SCORE: 75.0/100
======================================================================
TREND AND VOLATILITY ANALYSIS
======================================================================
GLOBAL EQUITIES (ACWI):
Short-Term Trend (5d): +2.66% | ABOVE EMA 10
Medium-Term Trend (20d): +6.83% | ABOVE EMA 50
Long-Term Trend (60d): +3.40% | ABOVE EMA 200
Volatility 5d: 8.3%
Volatility 20d: 21.8%
Volatility 60d: 17.3%
COMMODITIES (DBC):
Medium-Term Trend (20d): +0.94% | ABOVE EMA 50
Volatility 20d: 25.3%
ACWI/BND Correlation (30d): 0.689
REGIME INTERPRETATION:
The market is in a risk-on regime. Equities show positive trends across multiple
time horizons and volatility remains contained. Investors favor risk assets.
Suggested positioning: OVERWEIGHT equities.
⚠️ COMMODITIES ALERT: Commodities show elevated volatility. This may
indicate uncertainty around economic growth or unstable supply/demand dynamics.
======================================================================
ASSET RANKING - WHO IS PERFORMING BEST?
======================================================================
🥇 1. Global Equities (ACWI) - SCORE: 100/100
Price: $148.90
Trend: ABOVE EMA10 | ABOVE EMA50 | ABOVE EMA200
Performance: 5d +2.66% | 20d +6.83% | 60d +3.40%
Volatility: 5d 8.3% | 20d 21.8% | 60d 17.3%
Drawdown: 0.00%
→ Asset in STRONG HEALTH: positive trends and controlled volatility
🥈 2. Global Bonds (BND) - SCORE: 100/100
Price: $73.77
Trend: ABOVE EMA10 | ABOVE EMA50 | ABOVE EMA200
Performance: 5d +0.18% | 20d +0.35% | 60d +0.48%
Volatility: 5d 3.3% | 20d 5.1% | 60d 4.1%
Drawdown: -1.23%
→ Asset in STRONG HEALTH: positive trends and controlled volatility
🥉 3. Commodities (DBC) - SCORE: 90/100
Price: $29.11
Trend: ABOVE EMA10 | ABOVE EMA50 | ABOVE EMA200
Performance: 5d +2.14% | 20d +0.94% | 60d +22.57%
Volatility: 5d 14.9% | 20d 25.3% | 60d 25.7%
Drawdown: -1.26%
→ Asset in STRONG HEALTH: positive trends and controlled volatility
======================================================================
CORRELATION ANALYSIS - CURRENT vs HISTORICAL
======================================================================
ACWI/BND:
Current correlation (30d): +0.689
Historical average (1 year): +0.183
Deviation: +0.506
⚠️ SIGNIFICANT DEVIATION from historical average
→ Positive correlation: diversification COMPROMISED
BND/DBC:
Current correlation (30d): -0.466
Historical average (1 year): -0.272
Deviation: -0.194
ACWI/DBC:
Current correlation (30d): -0.661
Historical average (1 year): +0.010
Deviation: -0.671
⚠️ SIGNIFICANT DEVIATION from historical average
→ Negative correlation: possible supply-driven shift
======================================================================
OPERATIONAL SUMMARY
======================================================================
STRONGEST ASSET: Global Equities (Score: 100/100)
WEAKEST ASSET: Commodities (Score: 90/100)
SUGGESTED ACTION: Favor the strongest asset, maintain risk exposure.
DIVERSIFICATION: POOR - Asset classes tend to move together.
======================================================================
Analysis automatically generated by kbmeter.com
Date: 2026-04-17
The day does not feature any significant macroeconomic data releases, and on the earnings front there are no major market-moving events to report.
Already a subscriber? Login here
NOTES AND WARNINGS
Data compiled by kbmeter.com. Analysis date: 17 April 2026 - 7:48 AM GMT+1
This content is provided for informational purposes only and should not be considered financial advice. All scores and assessments are based on the previous trading day’s closing prices. Futures indications refer to the date and time of the analysis.