Financial Markets: Middle East Tensions and Earnings Set the Tone as a Volatile, Uncertain Week Begins
The weekend brings turmoil to financial markets. It’s not the first time, and it likely won’t be the last. Negotiations between the U.S. and Iran are intensifying, tensions are rising, and volatility remains elevated. Oil is gaining again, while futures indicate a flat opening for the United States and a slightly positive start for Europe.
Investors will try to maintain the risk-on momentum built up last week, also keeping an eye on earnings (with Tesla and Intel reporting this week) and macro data (including upcoming U.S. retail sales figures for March and the flash estimate of April PMI surveys).
Market Weather Map
April 20, 2026
US Equities
Eu Equities
Asia Equities
Commodities
Bonds
Dollar Index
Technology
Gold
Oil
Crypto
Market Summary
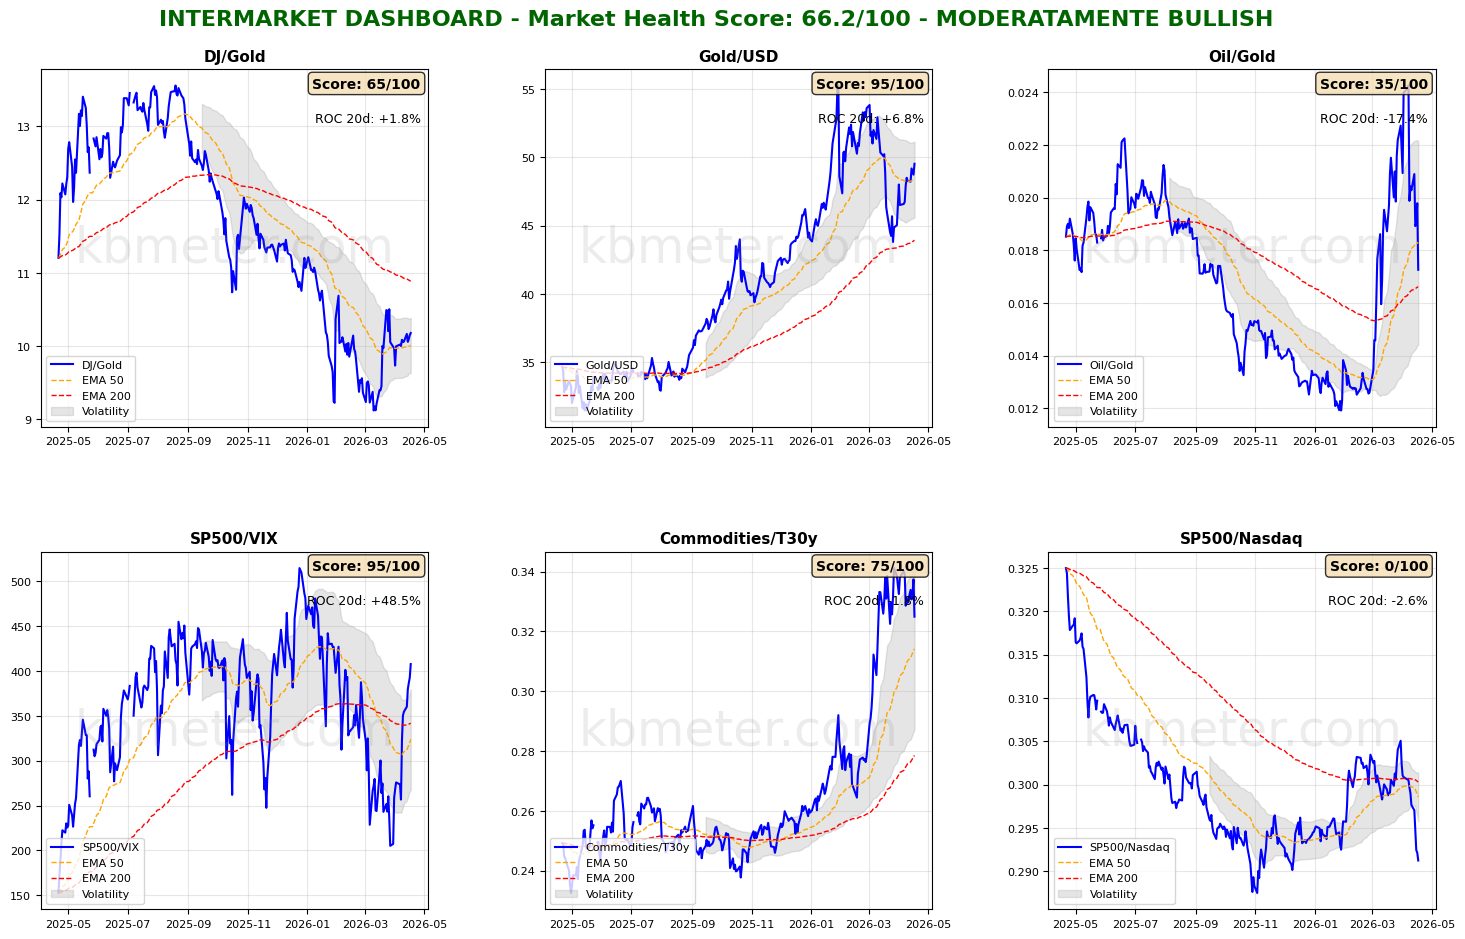
Financial markets currently show a neutral to moderately positive sentiment. Intermarket analysis highlights a Market Health Score of 66/100 (positive). Our intermarket dashboards reflect the situation at the end of last week, with risk appetite indicators still recovering and the Oil/Gold ratio heading straight downward toward its long-term moving average. However, in a high-volatility environment, everything can be called into question—or at least put on hold—over the course of a single weekend.
On the asset side, the start of the week shows a strong rebound in global equities and a more moderate recovery in global bonds.
Pre-market futures: Global futures point to a moderately risk-off sentiment (average -0.06%), with the U.S. slightly negative (-0.12%), Europe slightly positive (+0.16%), and Asia negative (-0.63%).
📊 Global Futures – Pre-Market Sentiment
- TecDAX derived: +3.26%
- IBEX 35 derived: +2.52%
- Dow Jones 30 cv1: +1.79%
- CAC 40 derived: -2.20%
- Euro Stoxx 50 derived: -1.22%
- Nikkei 225 derived: -1.20%
📄 Detailed Intermarket Analysis
INTERMARKET ANALYSIS - 2026-04-20
============================================================

MARKET HEALTH SCORE: 66.2/100
SENTIMENT: MODERATELY BULLISH

============================================================
MAIN RATIOS SUMMARY
============================================================


DJ/Gold:
  - Component score: 65.0/100
  - Current value: 10.1794
  - Position vs EMA50: ABOVE
  - 20-day ROC: +1.76%
  - 50-day ROC: +1.18%
  → Preference for risky assets vs safe haven

Gold/USD:
  - Component score: 95.0/100
  - Current value: 49.5168
  - Position vs EMA50: ABOVE
  - 20-day ROC: +6.80%
  - 50-day ROC: -1.76%

Oil/Gold:
  - Component score: 35.0/100
  - Current value: 0.0173
  - Position vs EMA50: BELOW
  - 20-day ROC: -17.40%
  - 50-day ROC: +30.39%
  → Weakening energy demand

SP500/VIX:
  - Component score: 95.0/100
  - Current value: 407.6694
  - Position vs EMA50: ABOVE
  - 20-day ROC: +48.47%
  - 50-day ROC: +10.41%
  → Expanding risk appetite

Commodities/T30y:
  - Component score: 75.0/100
  - Current value: 0.3249
  - Position vs EMA50: ABOVE
  - 20-day ROC: -1.83%
  - 50-day ROC: +15.39%
  → Economic growth expectations

SP500/Nasdaq:
  - Component score: 0.0/100
  - Current value: 0.2912
  - Position vs EMA50: BELOW
  - 20-day ROC: -2.62%
  - 50-day ROC: -3.08%
  - ⚠️ ANOMALY DETECTED - Significant deviation from the mean

============================================================
CONCLUSIONS AND RECOMMENDATIONS
============================================================

The market is moderately constructive. Some ratios show positive signals,
but elements of caution remain. Monitor developments closely.
Positioning: SELECTIVE, favor quality.


STRONGEST RATIOS:
  • Gold/USD: 95.0/100
  • SP500/VIX: 95.0/100
  • Commodities/T30y: 75.0/100

WEAKEST RATIOS:
  • DJ/Gold: 65.0/100
  • Oil/Gold: 35.0/100
  • SP500/Nasdaq: 0.0/100

============================================================
Analysis automatically generated by kbmeter.com
Date: 2026-04-20
📄 Detailed Asset Allocation Analysis
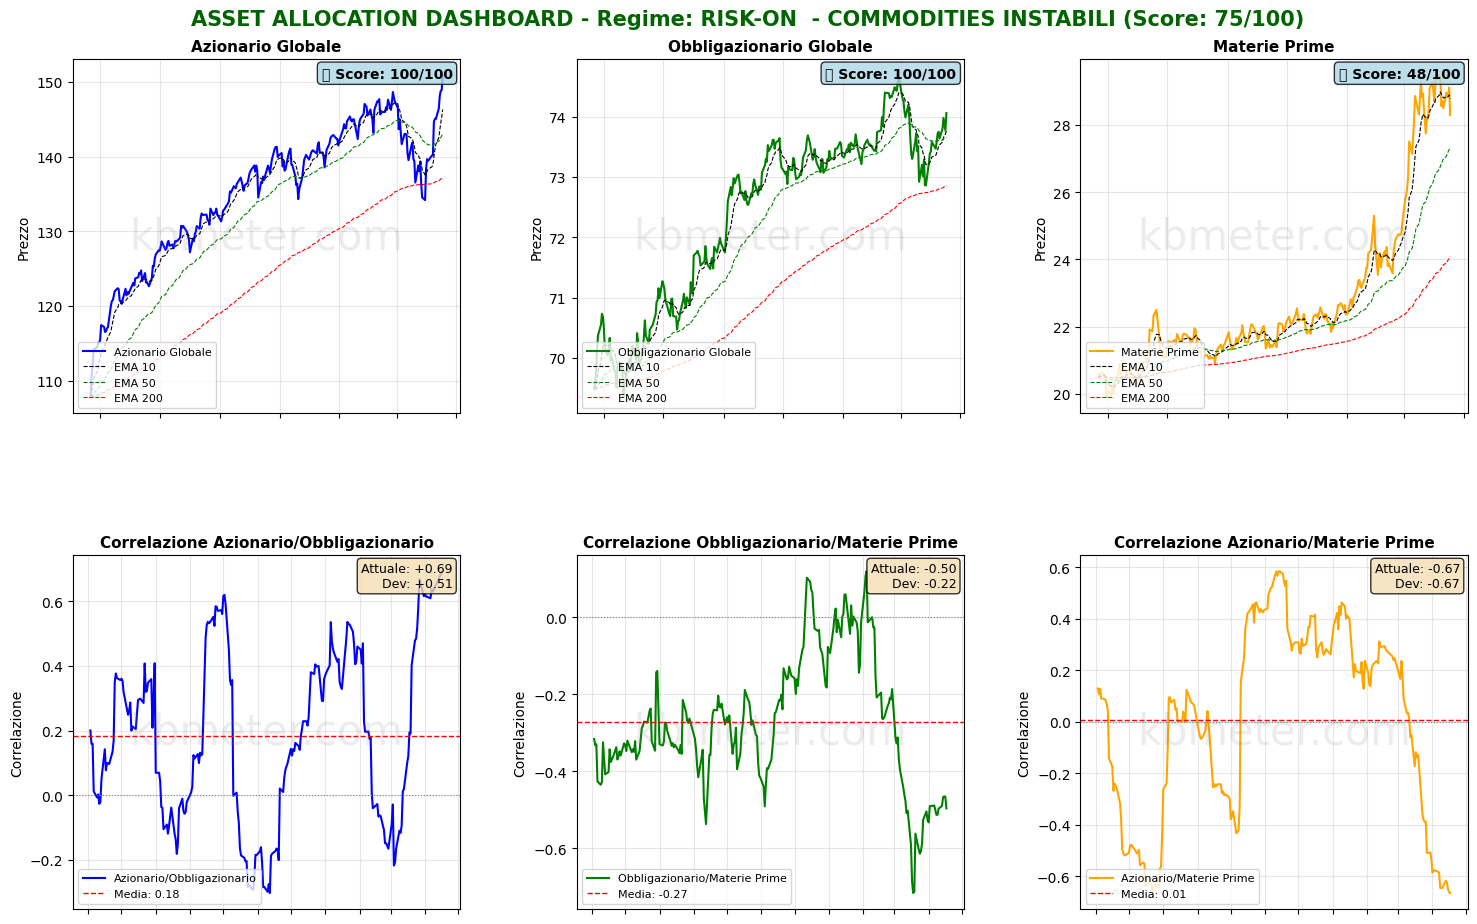
ASSET ALLOCATION & REGIME ANALYSIS - 2026-04-20
======================================================================

MARKET REGIME: RISK-ON - UNSTABLE COMMODITIES
REGIME SCORE: 75.0/100

======================================================================
TREND AND VOLATILITY ANALYSIS
======================================================================

GLOBAL EQUITIES (ACWI):
  Short-Term Trend (5d): +3.07% | ABOVE EMA 10
  Medium-Term Trend (20d): +10.52% | ABOVE EMA 50
  Long-Term Trend (60d): +4.21% | ABOVE EMA 200

  5d Volatility: 8.3%
  20d Volatility: 22.0%
  60d Volatility: 17.4%

COMMODITIES (DBC):
  Medium-Term Trend (20d): -2.25% | ABOVE EMA 50
  20d Volatility: 26.7%

ACWI/BND Correlation (30d): 0.694

REGIME INTERPRETATION:
The market is in a risk-on regime. Equities show positive trends across multiple
time horizons and volatility remains contained. Investors favor risky assets.
Suggested positioning: OVERWEIGHT equities.

⚠️ COMMODITIES ALERT: Commodities show elevated volatility. This may
indicate uncertainty around economic growth or unstable supply/demand dynamics.

======================================================================
ASSET RANKING - WHO IS PERFORMING BEST?
======================================================================

🥇 1. Global Equities (ACWI) - SCORE: 100/100
     Price: $150.90
     Trend: ABOVE EMA10 | ABOVE EMA50 | ABOVE EMA200
     Performance: 5d +3.07% | 20d +10.52% | 60d +4.21%
     Volatility: 5d 8.3% | 20d 22.0% | 60d 17.4%
     Drawdown: 0.00%
     → Asset in STRONG CONDITION: positive trends and controlled volatility

🥈 2. Global Bonds (BND) - SCORE: 100/100
     Price: $74.06
     Trend: ABOVE EMA10 | ABOVE EMA50 | ABOVE EMA200
     Performance: 5d +0.35% | 20d +1.56% | 60d +0.83%
     Volatility: 5d 3.9% | 20d 5.2% | 60d 4.1%
     Drawdown: -0.84%
     → Asset in STRONG CONDITION: positive trends and controlled volatility

🥉 3. Commodities (DBC) - SCORE: 48/100
     Price: $28.29
     Trend: BELOW EMA10 | ABOVE EMA50 | ABOVE EMA200
     Performance: 5d -2.31% | 20d -2.25% | 60d +19.17%
     Volatility: 5d 26.6% | 20d 26.7% | 60d 26.4%
     Drawdown: -4.04%
     → Asset in NEUTRAL CONDITION: mixed signals

======================================================================
CORRELATION ANALYSIS - CURRENT vs HISTORICAL
======================================================================

ACWI/BND:
  Current correlation (30d): +0.694
  Historical average (1 year): +0.185
  Deviation: +0.509
  ⚠️ SIGNIFICANT DEVIATION from historical average
  → Positive correlation: diversification COMPROMISED

BND/DBC:
  Current correlation (30d): -0.496
  Historical average (1 year): -0.273
  Deviation: -0.223

ACWI/DBC:
  Current correlation (30d): -0.665
  Historical average (1 year): +0.006
  Deviation: -0.671
  ⚠️ SIGNIFICANT DEVIATION from historical average
  → Negative correlation: possible supply-driven shift

======================================================================
OPERATIONAL SUMMARY
======================================================================

STRONGEST ASSET: Global Equities (Score: 100/100)
WEAKEST ASSET: Commodities (Score: 48/100)

SUGGESTED ACTION: Favor the strongest asset, maintain risk exposure.
DIVERSIFICATION: WEAK - Asset classes tend to move together.

======================================================================
Analysis automatically generated by kbmeter.com
Date: 2026-04-20
On the macro front, the day does not offer particularly significant catalysts. Notable events include the Chinese central bank’s decision on 1- and 5-year prime rates, German producer prices for March 2026, and the final reading of Canadian inflation for March 2026.
On the earnings front, the week will feature important reports, including those from Tesla, Intel, and IBM. Today, attention is focused on Rio Tinto, Infosys, and the U.S. banking sector.
Already a subscriber? Login here
NOTES AND WARNINGS
Data compiled by kbmeter.com. Analysis date: 20 April 2026 - 7:29 AM GMT+1
This content is provided for informational purposes only and should not be considered financial advice. All scores and assessments are based on the previous trading day’s closing prices. Futures indications refer to the date and time of the analysis.