Financial markets lack clear direction as investors await key U.S. macro data
As markets await a busy macro week to get fully underway—with U.S. labor market data due tomorrow and inflation figures on Friday—financial assets continue to trade with limited directionality. Still, equities managed to put together a broadly positive Monday, gold showed signs of stabilization, while cryptocurrencies remained under pressure. Overall sentiment stays in neutral territory. Futures point to a positive open for European markets, while uncertainty remains higher for Wall Street.
Market Weather Map
February 10, 2026
US Equities
Eu Equities
Asia Equities
Commodities
Bonds
Dollar Index
Technology
Gold
Oil
Crypto
Market Summary
How to interpret our financial indicators? Find out here.
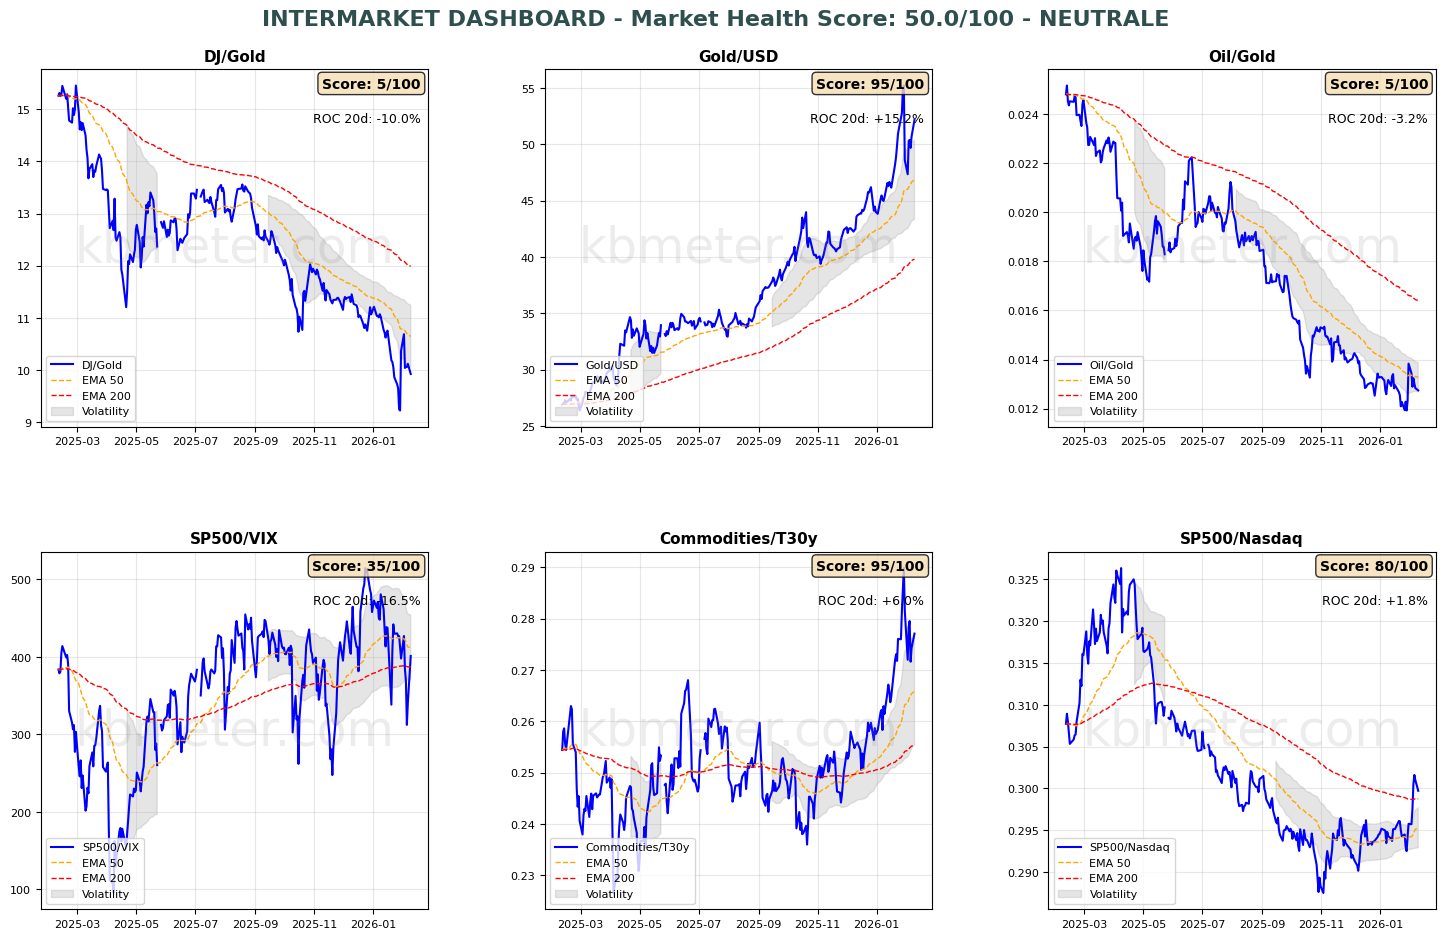
Financial markets today reflect a neutral to moderately positive sentiment. Intermarket analysis shows a Market Health Score of 50/100, consistent with a neutral backdrop. Our intermarket dashboards continue to highlight an uncertain environment: risk indicators have recovered somewhat from last week’s levels but remain close to their 200-day moving averages.
From an asset-class perspective, there are few notable changes. Medium-term trends remain intact, while short-term volatility has increased sharply.
Pre-market futures indicate a moderate risk-on tone globally (+0.29% on average), with the U.S. slightly negative (-0.04%), Europe modestly positive (+0.34%), and Asia firmly positive (+0.59%).
📊 Global Futures – Pre-Market Sentiment
- FTSE MIB derived: +2.05%
- CSI 300: +1.31%
- IBEX 35 derived: +1.11%
- Hang Seng derived: -0.38%
- US Tech 100 derived: -0.11%
- CAC 40 derived: -0.08%
📄 Detailed Intermarket Analysis
INTERMARKET ANALYSIS - 2026-02-10
============================================================

MARKET HEALTH SCORE: 50.0/100
SENTIMENT: NEUTRAL

============================================================
SUMMARY OF KEY RATIOS
============================================================


DJ/Gold:
  - Component score: 5.0/100
  - Current value: 9.9261
  - Position vs EMA50: BELOW
  - 20-day ROC: -9.96%
  - 50-day ROC: -12.79%
  → Flight to safe havens

Gold/USD:
  - Component score: 95.0/100
  - Current value: 52.1679
  - Position vs EMA50: ABOVE
  - 20-day ROC: +15.17%
  - 50-day ROC: +25.61%

Oil/Gold:
  - Component score: 5.0/100
  - Current value: 0.0127
  - Position vs EMA50: BELOW
  - 20-day ROC: -3.22%
  - 50-day ROC: -8.99%
  → Energy demand weakening

SP500/VIX:
  - Component score: 35.0/100
  - Current value: 401.1993
  - Position vs EMA50: BELOW
  - 20-day ROC: -16.55%
  - 50-day ROC: +10.06%
  → Risk appetite contracting

Commodities/T30y:
  - Component score: 95.0/100
  - Current value: 0.2771
  - Position vs EMA50: ABOVE
  - 20-day ROC: +5.99%
  - 50-day ROC: +13.48%
  → Economic growth expectations

SP500/Nasdaq:
  - Component score: 80.0/100
  - Current value: 0.2997
  - Position vs EMA50: ABOVE
  - 20-day ROC: +1.84%
  - 50-day ROC: +2.00%
  - ⚠️ ANOMALY DETECTED – Significant deviation from the average

============================================================
CONCLUSIONS AND RECOMMENDATIONS
============================================================

The market is in a neutral/sideways phase. Conflicting signals across ratios.
Lack of clear direction. Wait for confirmation.
Positioning: BALANCED, avoid excesses.


STRONGEST RATIOS:
  • Gold/USD: 95.0/100
  • Commodities/T30y: 95.0/100
  • SP500/Nasdaq: 80.0/100

WEAKEST RATIOS:
  • SP500/VIX: 35.0/100
  • DJ/Gold: 5.0/100
  • Oil/Gold: 5.0/100

============================================================
Analysis automatically generated by kbmeter.com
Date: 2026-02-10
📄 Detailed Asset Allocation Analysis
ASSET ALLOCATION & REGIME ANALYSIS - 2026-02-10
======================================================================
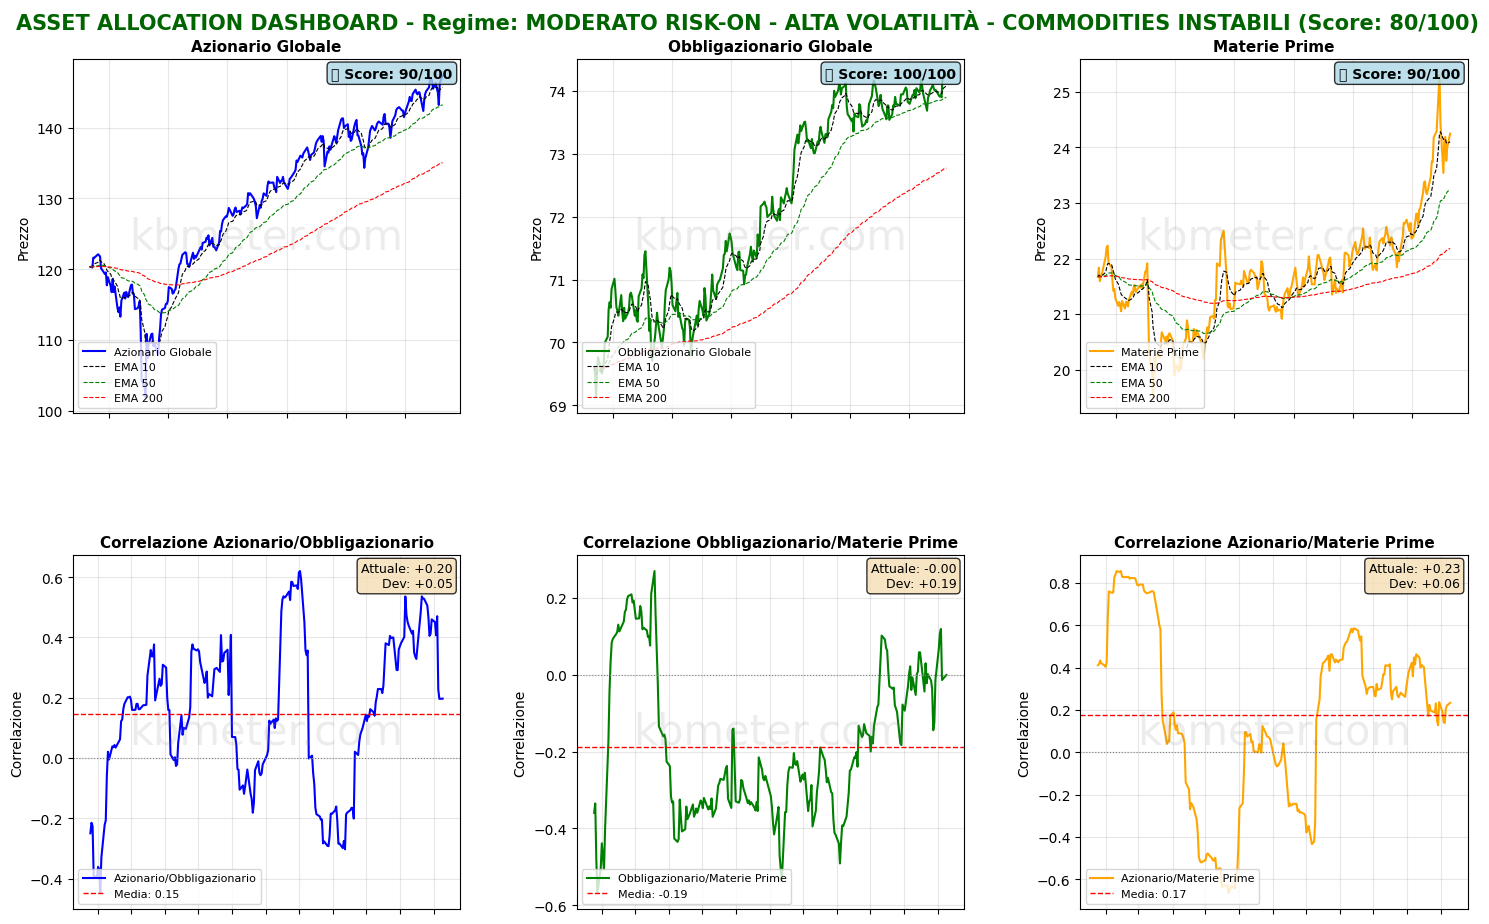
MARKET REGIME: MODERATE RISK-ON - HIGH VOLATILITY - UNSTABLE COMMODITIES
REGIME SCORE: 80.0/100
======================================================================
TREND AND VOLATILITY ANALYSIS
======================================================================
GLOBAL EQUITIES (ACWI):
Short-Term Trend (5d): +1.28% | ABOVE EMA 10
Medium-Term Trend (20d): +1.40% | ABOVE EMA 50
Long-Term Trend (60d): +4.48% | ABOVE EMA 200
Volatility 5d: 21.0%
Volatility 20d: 13.8%
Volatility 60d: 11.8%
COMMODITIES (DBC):
Medium-Term Trend (20d): +4.57% | ABOVE EMA 50
Volatility 20d: 25.9%
ACWI/BND Correlation (30d): 0.197
REGIME INTERPRETATION:
The market shows a pro-risk bias, though with some cautionary elements.
The trend is constructive, but conflicting signals may emerge across time horizons.
Suggested positioning: BALANCED, with a slight tilt toward risk assets.
⚠️ VOLATILITY ALERT: Volatility is elevated or rising rapidly. This increases risk
even in the presence of positive trends. Reduce position sizing and increase
monitoring frequency.
⚠️ COMMODITIES ALERT: Commodities are showing elevated volatility. This may
signal uncertainty around economic growth or unstable supply/demand dynamics.
======================================================================
ASSET RANKING – WHO IS PERFORMING BEST?
======================================================================
🥇 1. Global Bonds (BND) - SCORE: 100/100
Price: $74.25
Trend: ABOVE EMA10 | ABOVE EMA50 | ABOVE EMA200
Performance: 5d +0.43% | 20d +0.37% | 60d +0.66%
Volatility: 5d 3.1% | 20d 2.7% | 60d 2.7%
Drawdown: 0.00%
→ Asset in EXCELLENT HEALTH: positive trends and controlled volatility
🥈 2. Global Equities (ACWI) - SCORE: 90/100
Price: $147.41
Trend: ABOVE EMA10 | ABOVE EMA50 | ABOVE EMA200
Performance: 5d +1.28% | 20d +1.40% | 60d +4.48%
Volatility: 5d 21.0% | 20d 13.8% | 60d 11.8%
Drawdown: 0.00%
→ Asset in EXCELLENT HEALTH: positive trends and controlled volatility
🥉 3. Commodities (DBC) - SCORE: 90/100
Price: $24.25
Trend: ABOVE EMA10 | ABOVE EMA50 | ABOVE EMA200
Performance: 5d +0.41% | 20d +4.57% | 60d +8.79%
Volatility: 5d 25.3% | 20d 25.9% | 60d 18.3%
Drawdown: -4.15%
→ Asset in EXCELLENT HEALTH: positive trends, but elevated volatility
======================================================================
CORRELATION ANALYSIS – CURRENT vs HISTORICAL
======================================================================
ACWI/BND:
Current correlation (30d): +0.197
Historical average (1 year): +0.147
Deviation: +0.050
→ Weak correlation: moderate diversification
BND/DBC:
Current correlation (30d): -0.000
Historical average (1 year): -0.187
Deviation: +0.187
ACWI/DBC:
Current correlation (30d): +0.234
Historical average (1 year): +0.174
Deviation: +0.059
======================================================================
OPERATIONAL SUMMARY
======================================================================
STRONGEST ASSET: Global Bonds (Score: 100/100)
WEAKEST ASSET: Commodities (Score: 90/100)
SUGGESTED ACTION: Favor the strongest asset while maintaining risk exposure.
DIVERSIFICATION: EXCELLENT – Asset classes are moving largely independently.
======================================================================
Analysis automatically generated by kbmeter.com
Date: 2026-02-10
On the macro front, today’s focus is on U.S. retail sales for December 2025. Also worth watching are the weekly ADP employment report and U.S. labor cost data for the fourth quarter of 2025.
On the earnings side, the day features results from several major companies, including Coca-Cola, AstraZeneca, Ford, Ferrari, Spotify, and Robinhood.
Already a subscriber? Login here
NOTES AND WARNINGS
Analysis automatically generated by kbmeter.com. Analysis date: 10 February 2026 - 7:51 AM GMT+1
This content is provided for informational purposes only and should not be considered financial advice. All scores and assessments are based on the previous trading day’s closing prices. Futures indications refer to the date and time of the analysis.