Financial Markets in Wait-and-See Mode Ahead of April 2026 U.S. Inflation Data
A wait-and-see attitude prevails across financial markets, as investors attempt to interpret the latest developments in the Middle East and prepare to assess the April 2026 U.S. inflation data. Sentiment remains neutral to moderately positive, although volatility continues to stay elevated, and only one asset class in our weather map exceeds a 60-point Health Score — the U.S. technology sector. Futures point to a negative opening for both Europe and the United States.
Market Weather Map
May 12, 2026
US Equities
Eu Equities
Asia Equities
Commodities
Bonds
Dollar Index
Technology
Gold
Oil
Crypto
Market Summary
Financial markets sentiment
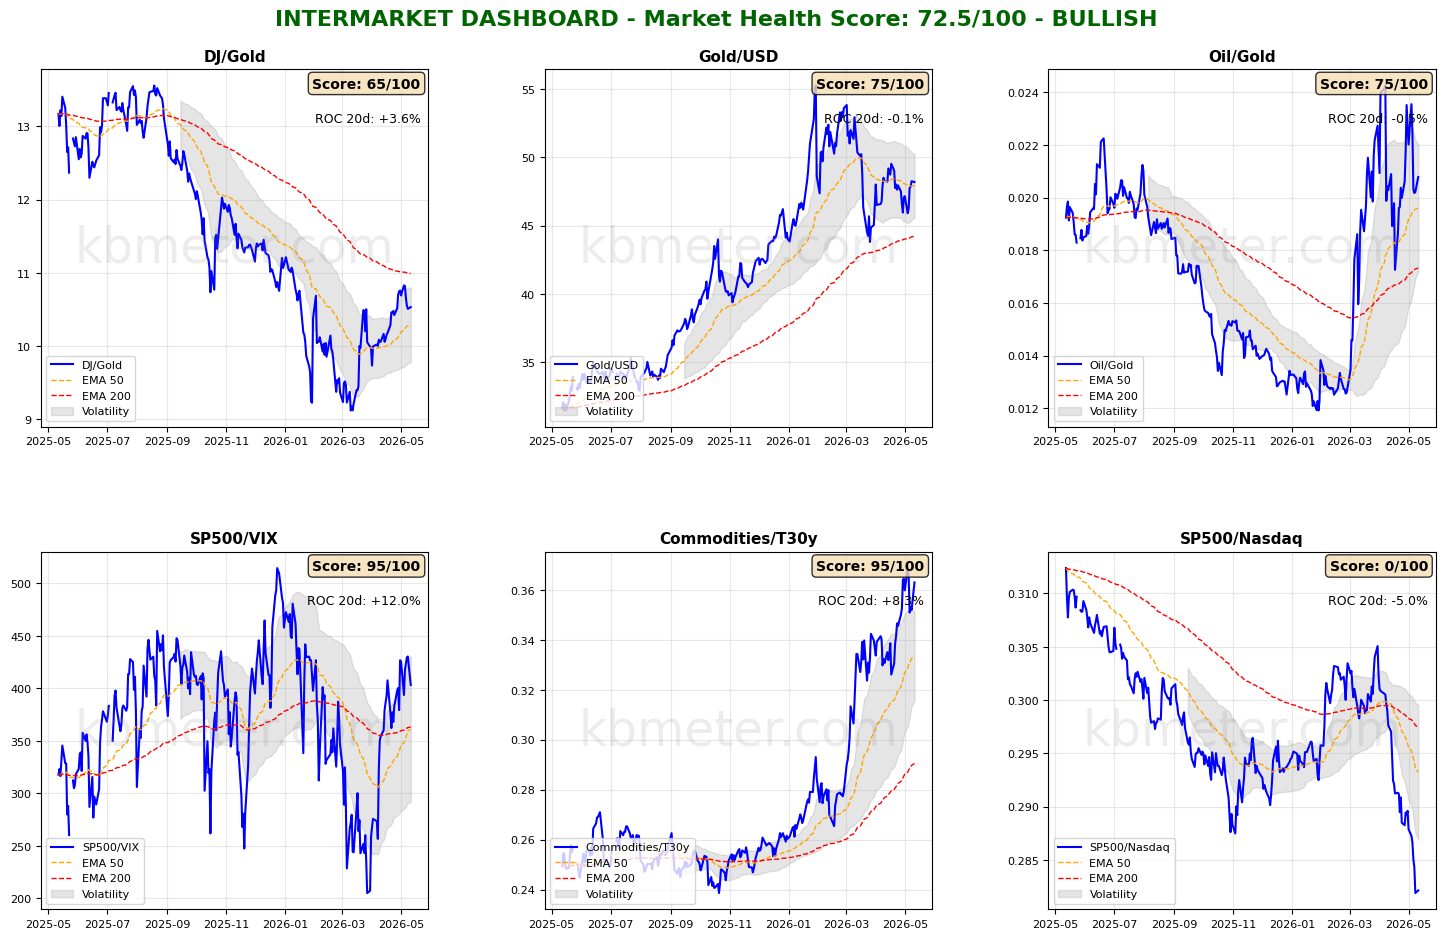
Financial markets are currently showing a neutral to moderately positive sentiment. Intermarket analysis indicates a Market Health Score of 72/100 (positive). “Waiting” appears to be the most appropriate word to describe the signals emerging from our intermarket dashboards. Risk appetite indicators remain stable, while the ratio between commodities and 30-year Treasuries continues to hover near its highs. This indicator still points to expectations of persistently elevated inflation — a particularly interesting metric to monitor on the day of the April 2026 U.S. inflation release.
Across asset classes, the situation remains broadly unchanged, with bonds continuing to trade around their medium-term moving average, while equities remain relatively stable above the fast-moving average.
As for our financial market weather map, the technology sector continues to be the standout performer of recent weeks, approaching a Health Score of 65 points with positive momentum. Bonds, oil, and the U.S. dollar remain below the 50-point threshold.
Global Futures – Pre-Market Sentiment
Pre-Market Futures: Global futures indicate a moderately risk-off sentiment (average -0.18%), with U.S. futures slightly negative (-0.25%), European futures slightly negative (-0.33%), and Asian futures slightly positive (+0.34%).
📊 Global Futures – Pre-Market Sentiment
- CSI 300: +1.72%
- FTSE MIB derived: +0.76%
- Mini MDAX derived: +0.00%
- Mini DAX: -0.91%
- DAX derived: -0.88%
- Euro Stoxx 50 derived: -0.71%
Intermarket details
📄 Detailed Intermarket Analysis
INTERMARKET ANALYSIS - 2026-05-12
============================================================

MARKET HEALTH SCORE: 72.5/100
SENTIMENT: BULLISH

============================================================
SUMMARY OF KEY RATIOS
============================================================


DJ/Gold:
  - Component score: 65.0/100
  - Current value: 10.5335
  - Position vs EMA50: ABOVE
  - 20-day ROC: +3.60%
  - 50-day ROC: +12.49%
  → Preference for risk assets over safe havens

Gold/USD:
  - Component score: 75.0/100
  - Current value: 48.1795
  - Position vs EMA50: ABOVE
  - 20-day ROC: -0.06%
  - 50-day ROC: -10.09%

Oil/Gold:
  - Component score: 75.0/100
  - Current value: 0.0208
  - Position vs EMA50: ABOVE
  - 20-day ROC: -0.52%
  - 50-day ROC: +62.20%
  → Declining energy demand

SP500/VIX:
  - Component score: 95.0/100
  - Current value: 403.3101
  - Position vs EMA50: ABOVE
  - 20-day ROC: +11.98%
  - 50-day ROC: +16.44%
  → Expanding risk appetite

Commodities/T30y:
  - Component score: 95.0/100
  - Current value: 0.3630
  - Position vs EMA50: ABOVE
  - 20-day ROC: +8.34%
  - 50-day ROC: +29.92%
  → Economic growth expectations

SP500/Nasdaq:
  - Component score: 0.0/100
  - Current value: 0.2821
  - Position vs EMA50: BELOW
  - 20-day ROC: -5.01%
  - 50-day ROC: -7.03%
  - ⚠️ ANOMALY DETECTED - Significant deviation from the average

============================================================
CONCLUSIONS AND RECOMMENDATIONS
============================================================

The market is showing signs of broad strength. Intermarket ratios suggest
a favorable environment for risk-taking. Elevated risk appetite and positive trends.
Positioning: CONSTRUCTIVE on risk assets.


STRONGEST RATIOS:
  • SP500/VIX: 95.0/100
  • Commodities/T30y: 95.0/100
  • Gold/USD: 75.0/100

WEAKEST RATIOS:
  • Oil/Gold: 75.0/100
  • DJ/Gold: 65.0/100
  • SP500/Nasdaq: 0.0/100

============================================================
Data processed by kbmeter.com
Date: 2026-05-12
📄 Detailed Asset Allocation Analysis
ASSET ALLOCATION & REGIME ANALYSIS - 2026-05-12
======================================================================
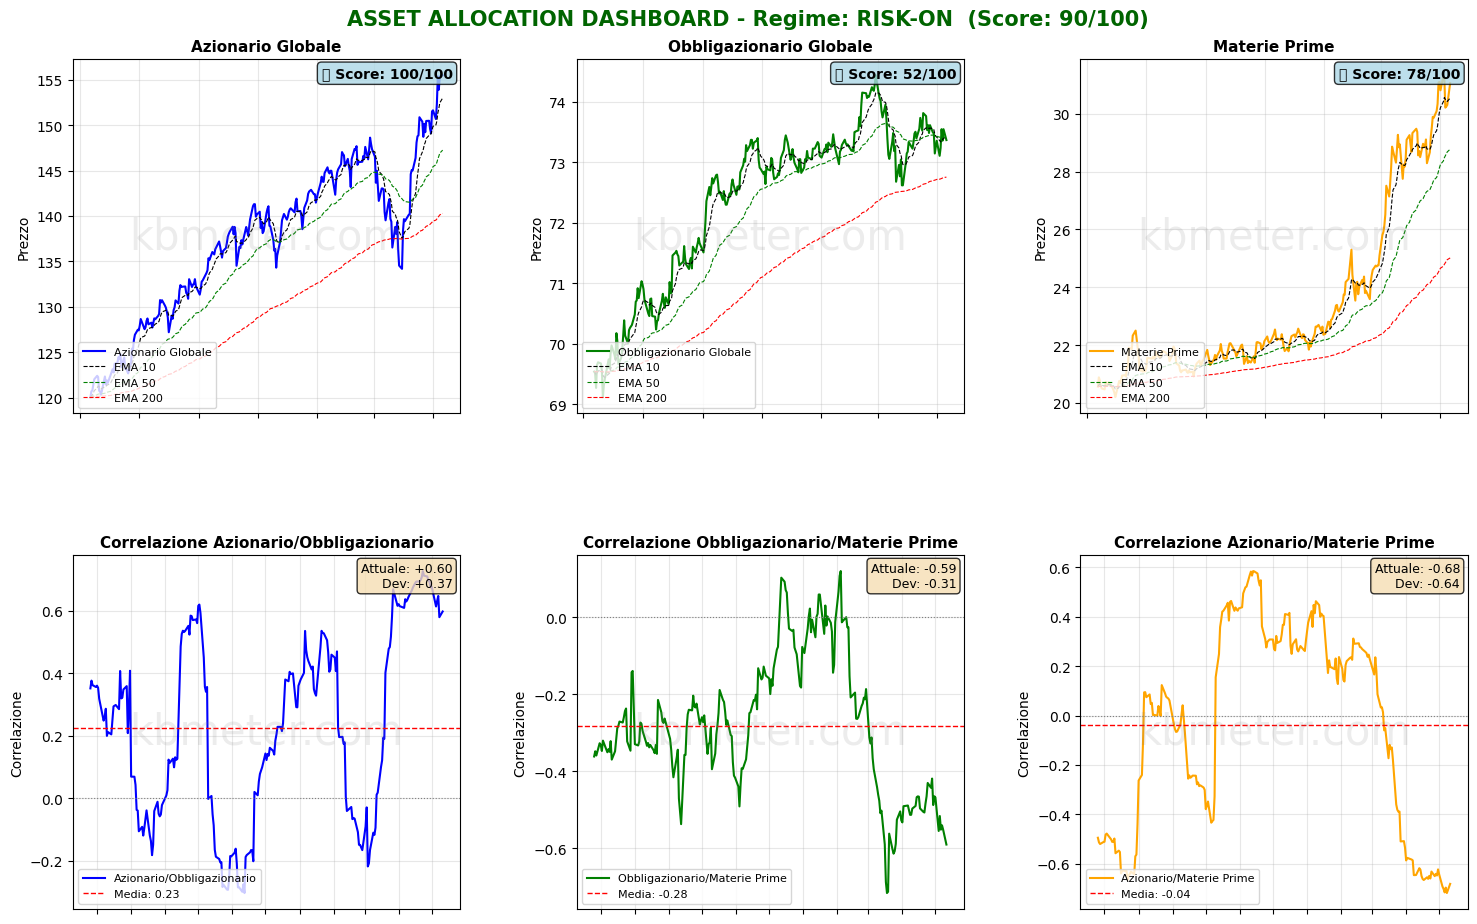
MARKET REGIME: RISK-ON
REGIME SCORE: 90.0/100
======================================================================
TREND AND VOLATILITY ANALYSIS
======================================================================
GLOBAL EQUITIES (ACWI):
Short-Term Trend (5d): +2.09% | ABOVE EMA 10
Medium-Term Trend (20d): +5.01% | ABOVE EMA 50
Long-Term Trend (60d): +6.57% | ABOVE EMA 200
5d Volatility: 17.7%
20d Volatility: 14.2%
60d Volatility: 17.6%
COMMODITIES (DBC):
Medium-Term Trend (20d): +7.70% | ABOVE EMA 50
20d Volatility: 23.5%
ACWI/BND Correlation (30d): 0.598
REGIME INTERPRETATION:
The market is in a risk-on regime. Equities are showing positive trends across multiple
time horizons, while volatility remains contained. Investors are favoring risk assets.
Suggested positioning: OVERWEIGHT equities.
======================================================================
ASSET RANKING - WHO IS PERFORMING BEST?
======================================================================
🥇 1. Global Equities (ACWI) - SCORE: 100/100
Price: $155.53
Trend: ABOVE EMA10 | ABOVE EMA50 | ABOVE EMA200
Performance: 5d +2.09% | 20d +5.01% | 60d +6.57%
Volatility: 5d 17.7% | 20d 14.2% | 60d 17.6%
Drawdown: 0.00%
→ Asset in STRONG HEALTH: positive trends and controlled volatility
🥈 2. Commodities (DBC) - SCORE: 78/100
Price: $31.06
Trend: ABOVE EMA10 | ABOVE EMA50 | ABOVE EMA200
Performance: 5d -0.45% | 20d +7.70% | 60d +30.07%
Volatility: 5d 32.2% | 20d 23.5% | 60d 24.4%
Drawdown: -0.86%
→ Asset in STRONG HEALTH: positive trends and controlled volatility
🥉 3. Global Bonds (BND) - SCORE: 52/100
Price: $73.37
Trend: BELOW EMA10 | BELOW EMA50 | ABOVE EMA200
Performance: 5d +0.18% | 20d -0.50% | 60d -1.06%
Volatility: 5d 4.9% | 20d 4.0% | 60d 4.3%
Drawdown: -1.44%
→ Asset in NEUTRAL condition: mixed signals
======================================================================
CORRELATION ANALYSIS - CURRENT vs HISTORICAL
======================================================================
ACWI/BND:
Current correlation (30d): +0.598
Historical average (1 year): +0.227
Deviation: +0.371
⚠️ SIGNIFICANT DEVIATION from historical average
→ Positive correlation: diversification COMPROMISED
BND/DBC:
Current correlation (30d): -0.590
Historical average (1 year): -0.283
Deviation: -0.307
⚠️ SIGNIFICANT DEVIATION from historical average
ACWI/DBC:
Current correlation (30d): -0.681
Historical average (1 year): -0.038
Deviation: -0.644
⚠️ SIGNIFICANT DEVIATION from historical average
→ Negative correlation: possible supply-driven shift
======================================================================
OPERATIONAL SUMMARY
======================================================================
STRONGEST ASSET: Global Equities (Score: 100/100)
WEAKEST ASSET: Global Bonds (Score: 52/100)
SUGGESTED ACTION: Favor the strongest asset and maintain risk exposure.
DIVERSIFICATION: POOR - Asset classes tend to move together.
======================================================================
Data processed by kbmeter.com
Date: 2026-05-12
Macroeconomic calendar
Today’s macroeconomic focus revolves around the April 2026 U.S. inflation data. Attention should also be paid to the update on German investor confidence, Germany’s final April 2026 inflation figures, and consumer price data from India and Brazil.
Already a subscriber? Login here
NOTES AND WARNINGS
Data compiled by kbmeter.com. Analysis date: 12 May 2026 - 7:45 AM GMT+1
This content is provided for informational purposes only and should not be considered financial advice. All scores and assessments are based on the previous trading day’s closing prices. Futures indications refer to the date and time of the analysis.