Financial Markets Hold Risk-On Bias as Investors Await Developments; Middle East, Fed Governor Confirmation, and Apple in Focus
Financial markets are still in a waiting phase. Waiting for the new round of negotiations between Iran and the United States, which is expected to begin today. Waiting for the major quarterly earnings reports due later this week. And finally, waiting for confirmation of Kevin Warsh’s appointment as a Federal Reserve governor, with investors looking to the words of Powell’s successor for clues about the future moves of the U.S. central bank.
In this context—also shaken by the announcement of Tim Cook’s resignation as CEO of Apple—market sentiment remains moderately positive, while volatility is slowing but still at elevated levels. Futures indicate a positive opening for the United States and a slightly negative one for Europe.
Market Weather Map
April 21, 2026
US Equities
Eu Equities
Asia Equities
Commodities
Bonds
Dollar Index
Technology
Gold
Oil
Crypto
Market Summary
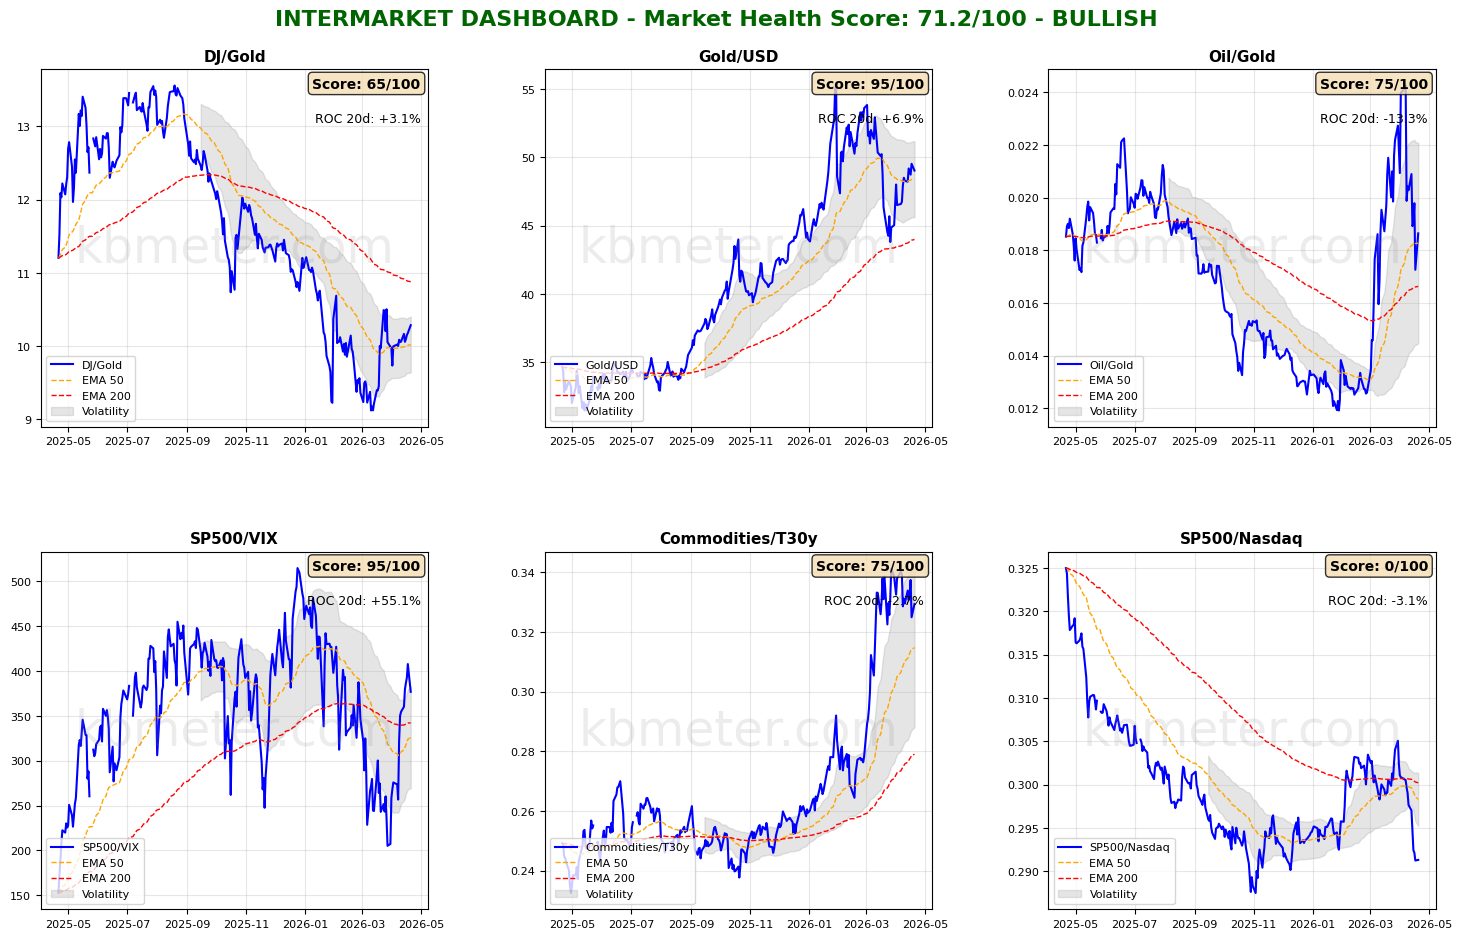
Financial markets today show a moderately positive sentiment. Intermarket analysis highlights a Market Health Score of 71/100 (positive). Our intermarket dashboards reflect the early-week slowdown imposed on markets by uncertainty surrounding the outcome of negotiations in the Middle East. That said, the current risk-on stance remains intact, with risk appetite indicators moving only marginally.
Meanwhile, gold continues its recovery against the dollar: the ratio between the two assets has returned to early March levels, climbing back above the 50-day moving average.
Across asset classes, the situation remains broadly stable, with rebounds in global equities and bonds still holding and prices well above medium- and long-term moving averages. Commodities are experiencing a short-term sideways phase, weighed down by volatility in the energy component.
Finally, looking at our “weather map,” no asset exceeds the 60-point threshold, with oil dropping below 50 and the dollar confirming itself as the weakest-rated asset.
Pre-Market Futures: Global futures signal a moderately risk-off sentiment (-0.01% on average), with the U.S. slightly positive (+0.24%), Europe slightly negative (-0.25%), and Asia slightly positive (+0.35%).
📊 Global Futures – Pre-Market Sentiment
- CSI 300: +0.62%
- Nikkei 225 derived: +0.53%
- DAX derived: +0.42%
- TecDAX derived: -1.58%
- IBEX 35 derived: -1.29%
- FTSE MIB derived: -0.87%
📄 Detailed Intermarket Analysis
INTERMARKET ANALYSIS - 2026-04-21
============================================================

MARKET HEALTH SCORE: 71.2/100
SENTIMENT: BULLISH

============================================================
SUMMARY OF KEY RATIOS
============================================================


DJ/Gold:
  - Component score: 65.0/100
  - Current value: 10.2864
  - Position vs EMA50: ABOVE
  - 20-day ROC: +3.15%
  - 50-day ROC: +2.24%
  → Preference for risk assets vs safe haven

Gold/USD:
  - Component score: 95.0/100
  - Current value: 49.0219
  - Position vs EMA50: ABOVE
  - 20-day ROC: +6.88%
  - 50-day ROC: -1.36%

Oil/Gold:
  - Component score: 75.0/100
  - Current value: 0.0186
  - Position vs EMA50: ABOVE
  - 20-day ROC: -13.34%
  - 50-day ROC: +43.20%
  → Declining energy demand

SP500/VIX:
  - Component score: 95.0/100
  - Current value: 376.7430
  - Position vs EMA50: ABOVE
  - 20-day ROC: +55.06%
  - 50-day ROC: +20.64%
  → Expanding risk appetite

Commodities/T30y:
  - Component score: 75.0/100
  - Current value: 0.3294
  - Position vs EMA50: ABOVE
  - 20-day ROC: -2.71%
  - 50-day ROC: +20.38%
  → Economic growth expectations

SP500/Nasdaq:
  - Component score: 0.0/100
  - Current value: 0.2913
  - Position vs EMA50: BELOW
  - 20-day ROC: -3.08%
  - 50-day ROC: -3.42%
  - ⚠️ ANOMALY DETECTED - Significant deviation from the mean

============================================================
CONCLUSIONS AND RECOMMENDATIONS
============================================================

The market shows broad signs of strength. Intermarket ratios suggest
a risk-friendly environment. High risk appetite and positive trends.
Positioning: CONSTRUCTIVE on risk assets.


STRONGEST RATIOS:
  • Gold/USD: 95.0/100
  • SP500/VIX: 95.0/100
  • Oil/Gold: 75.0/100

WEAKEST RATIOS:
  • Commodities/T30y: 75.0/100
  • DJ/Gold: 65.0/100
  • SP500/Nasdaq: 0.0/100

============================================================
Analysis automatically generated by kbmeter.com
Date: 2026-04-21
📄 Detailed Asset Allocation Analysis
ASSET ALLOCATION & REGIME ANALYSIS - 2026-04-21
======================================================================
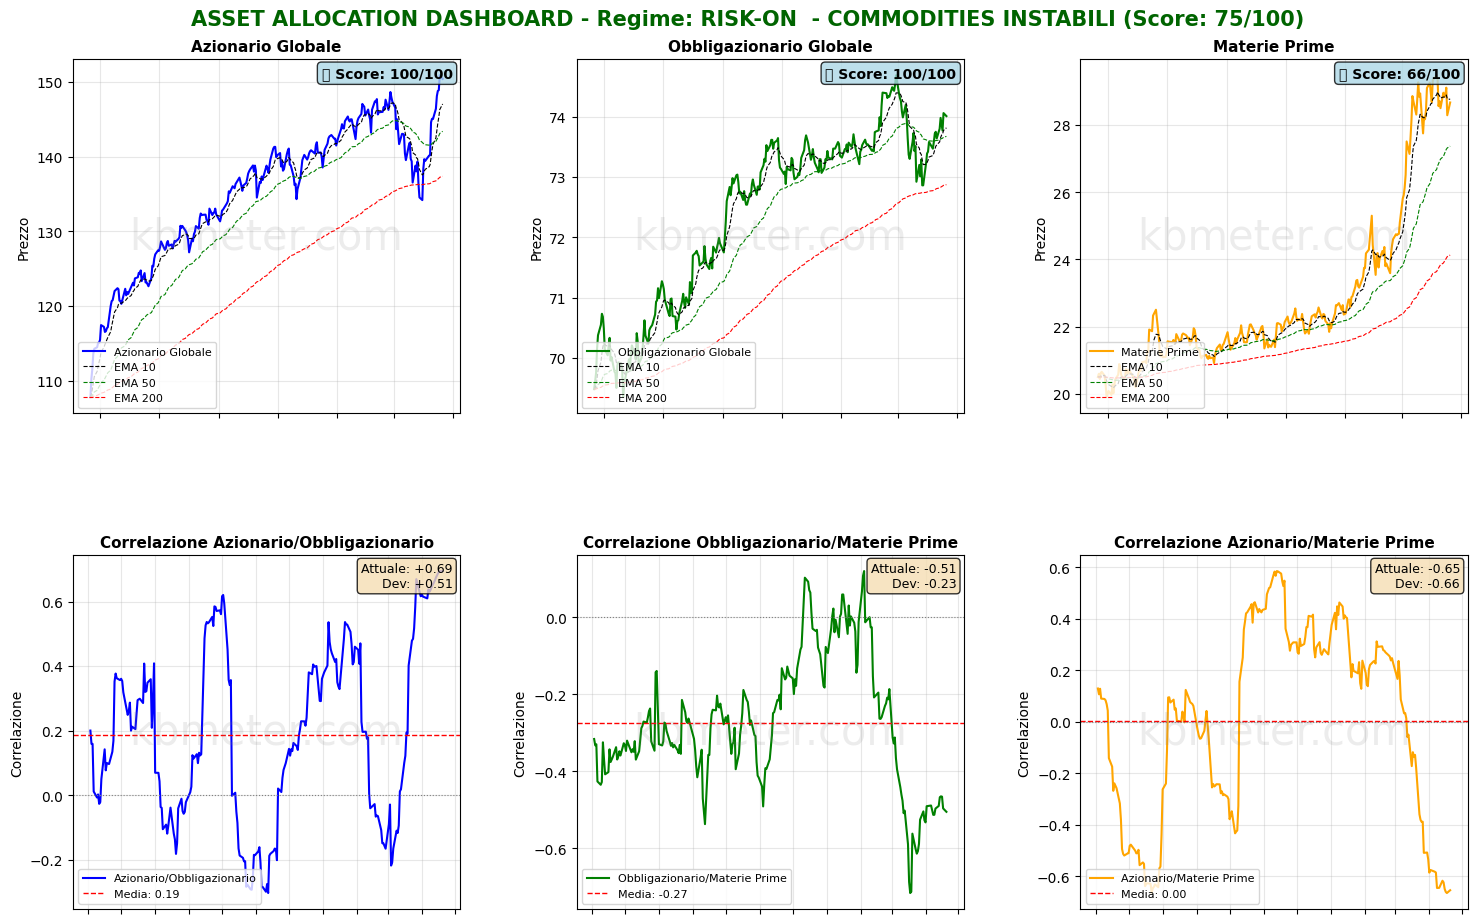
MARKET REGIME: RISK-ON - UNSTABLE COMMODITIES
REGIME SCORE: 75.0/100
======================================================================
TREND AND VOLATILITY ANALYSIS
======================================================================
GLOBAL EQUITIES (ACWI):
Short-Term Trend (5d): +1.55% | ABOVE EMA 10
Medium-Term Trend (20d): +8.36% | ABOVE EMA 50
Long-Term Trend (60d): +3.62% | ABOVE EMA 200
Volatility 5d: 11.2%
Volatility 20d: 20.2%
Volatility 60d: 17.4%
COMMODITIES (DBC):
Medium-Term Trend (20d): +3.32% | ABOVE EMA 50
Volatility 20d: 27.2%
ACWI/BND Correlation (30d): 0.694
REGIME INTERPRETATION:
The market is in a risk-on regime. Equities show positive trends across multiple
time horizons and volatility remains contained. Investors favor risk assets.
Suggested positioning: OVERWEIGHT equities.
⚠️ COMMODITIES ALERT: Commodities show elevated volatility. This may
indicate uncertainty around economic growth or unstable supply/demand dynamics.
======================================================================
ASSET RANKING - WHO IS PERFORMING BEST?
======================================================================
🥇 1. Global Equities (ACWI) - SCORE: 100/100
Price: $150.41
Trend: ABOVE EMA10 | ABOVE EMA50 | ABOVE EMA200
Performance: 5d +1.55% | 20d +8.36% | 60d +3.62%
Volatility: 5d 11.2% | 20d 20.2% | 60d 17.4%
Drawdown: -0.32%
→ Asset in STRONG HEALTH: positive trends and controlled volatility
🥈 2. Global Bonds (BND) - SCORE: 100/100
Price: $74.01
Trend: ABOVE EMA10 | ABOVE EMA50 | ABOVE EMA200
Performance: 5d +0.04% | 20d +1.11% | 60d +0.65%
Volatility: 5d 3.9% | 20d 4.2% | 60d 4.1%
Drawdown: -0.91%
→ Asset in STRONG HEALTH: positive trends and controlled volatility
🥉 3. Commodities (DBC) - SCORE: 66/100
Price: $28.67
Trend: BELOW EMA10 | ABOVE EMA50 | ABOVE EMA200
Performance: 5d -0.59% | 20d +3.32% | 60d +18.57%
Volatility: 5d 25.5% | 20d 27.2% | 60d 26.5%
Drawdown: -2.75%
→ Asset in FAIR CONDITION: mostly positive signals
======================================================================
CORRELATION ANALYSIS - CURRENT vs HISTORICAL
======================================================================
ACWI/BND:
Current correlation (30d): +0.694
Historical average (1 year): +0.187
Deviation: +0.507
⚠️ SIGNIFICANT DEVIATION from historical average
→ Positive correlation: diversification COMPROMISED
BND/DBC:
Current correlation (30d): -0.505
Historical average (1 year): -0.274
Deviation: -0.231
ACWI/DBC:
Current correlation (30d): -0.654
Historical average (1 year): +0.003
Deviation: -0.658
⚠️ SIGNIFICANT DEVIATION from historical average
→ Negative correlation: possible supply-driven shift
======================================================================
OPERATIONAL SUMMARY
======================================================================
STRONGEST ASSET: Global Equities (Score: 100/100)
WEAKEST ASSET: Commodities (Score: 66/100)
SUGGESTED ACTION: Favor the strongest asset, maintain risk exposure.
DIVERSIFICATION: WEAK - Asset classes tend to move together.
======================================================================
Analysis automatically generated by kbmeter.com
Date: 2026-04-21
On the macro front, today’s agenda includes UK employment data for the quarter ending last February, the ZEW index update for Germany and the Eurozone, and U.S. retail sales figures for March.
On the earnings front, today’s focus is on GE Aerospace, 3M, and United Airlines.
Already a subscriber? Login here
NOTES AND WARNINGS
Data compiled by kbmeter.com. Analysis date: 21 April 2026 - 7:44 AM GMT+1
This content is provided for informational purposes only and should not be considered financial advice. All scores and assessments are based on the previous trading day’s closing prices. Futures indications refer to the date and time of the analysis.