Financial Markets Hold Neutral Bias Amid Geopolitical Uncertainty; Positive Equity-Bond Correlation Weakens
The optimism that was emerging yesterday morning in financial markets quickly faded following much less encouraging news from the Middle East. The surge in oil prices shows no signs of slowing, and the first notable effect is a weakening in the positive correlation between global equities and bonds, with the latter falling below the 50-day moving average.
On the equity side, the technology sector remains positive, while gold and the dollar continue their phase of weakness. Sentiment remains in neutral territory, with the risk-off component easing slightly and volatility staying elevated. Futures are down this morning for Europe, while a slightly positive opening is expected for the United States.
Market Weather Map
May 5, 2026
US Equities
Eu Equities
Asia Equities
Commodities
Bonds
Dollar Index
Technology
Gold
Oil
Crypto
Market Summary
Financial markets sentiment
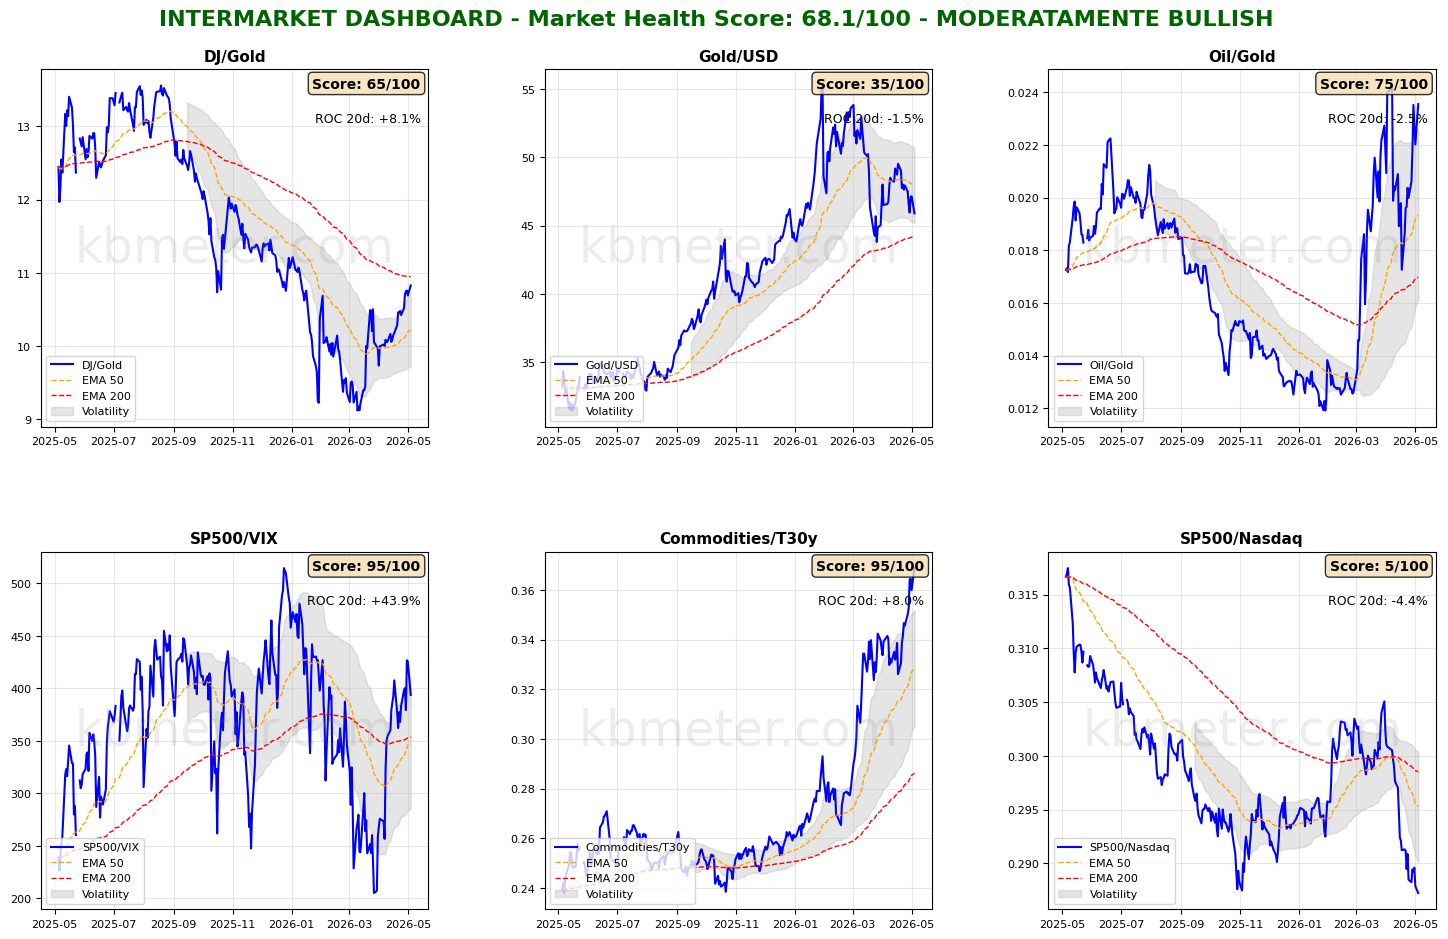
Financial markets are showing a neutral sentiment today. Intermarket analysis highlights a Market Health Score of 68/100 (positive). Our intermarket dashboards continue to indicate a stable situation compared to previous analyses. Risk appetite indicators show an increase in volatility.
Convincing signals seem to be coming from the technology sector, with the S&P 500/Nasdaq ratio hovering at its lowest levels since last November and the sector’s health score remaining around 60 points with positive momentum. Gold and the dollar continue their period of weakness, while oil remains strong amid geopolitical uncertainty.
As for asset classes, we are monitoring movements in the global bond market. Expectations of rising inflation and interest rates appear to be strengthening again in this segment. The noteworthy development—if we can call it that—is that after many weeks of increasing positive correlation, a decline is now being observed. This will be an important factor to watch closely in the coming days.
Global Futures – Pre-Market Sentiment
Pre-market futures: Global futures indicate a moderate risk-off sentiment (-0.44% on average), with the U.S. slightly positive (+0.22%), Europe negative (-0.79%), and Asia slightly negative (-0.26%).
📊 Global Futures – Pre-Market Sentiment
- CAC 40 derived: +0.34%
- Russell 2000: +0.34%
- US Tech 100 derived: +0.22%
- IBEX 35 derived: -2.97%
- FTSE MIB derived: -1.86%
- FTSE 100 derived: -0.97%
Intermarket details
📄 Detailed Intermarket Analysis
INTERMARKET ANALYSIS - 2026-05-05
============================================================

MARKET HEALTH SCORE: 68.1/100
SENTIMENT: MODERATELY BULLISH

============================================================
MAIN RATIOS SUMMARY
============================================================


DJ/Gold:
  - Component score: 65.0/100
  - Current value: 10.8291
  - Position vs EMA50: ABOVE
  - ROC 20 days: +8.05%
  - ROC 50 days: +10.40%
  → Preference for risk assets vs safe haven

Gold/USD:
  - Component score: 35.0/100
  - Current value: 45.8972
  - Position vs EMA50: BELOW
  - ROC 20 days: -1.46%
  - ROC 50 days: -11.28%

Oil/Gold:
  - Component score: 75.0/100
  - Current value: 0.0235
  - Position vs EMA50: ABOVE
  - ROC 20 days: -2.45%
  - ROC 50 days: +79.44%
  → Declining energy demand

SP500/VIX:
  - Component score: 95.0/100
  - Current value: 393.6987
  - Position vs EMA50: ABOVE
  - ROC 20 days: +43.92%
  - ROC 50 days: +8.77%
  → Expanding risk appetite

Commodities/T30y:
  - Component score: 95.0/100
  - Current value: 0.3688
  - Position vs EMA50: ABOVE
  - ROC 20 days: +7.99%
  - ROC 50 days: +32.56%
  → Economic growth expectations

SP500/Nasdaq:
  - Component score: 5.0/100
  - Current value: 0.2873
  - Position vs EMA50: BELOW
  - ROC 20 days: -4.44%
  - ROC 50 days: -4.86%

============================================================
CONCLUSIONS AND RECOMMENDATIONS
============================================================

The market is moderately constructive. Some ratios show positive signals,
but elements of caution remain. Monitor developments closely.
Positioning: SELECTIVE, favor quality.


STRONGEST RATIOS:
  • SP500/VIX: 95.0/100
  • Commodities/T30y: 95.0/100
  • Oil/Gold: 75.0/100

WEAKEST RATIOS:
  • DJ/Gold: 65.0/100
  • Gold/USD: 35.0/100
  • SP500/Nasdaq: 5.0/100

============================================================
Analysis automatically generated by kbmeter.com
Date: 2026-05-05
📄 Detailed Asset Allocation Analysis
ASSET ALLOCATION & REGIME ANALYSIS - 2026-05-05
======================================================================
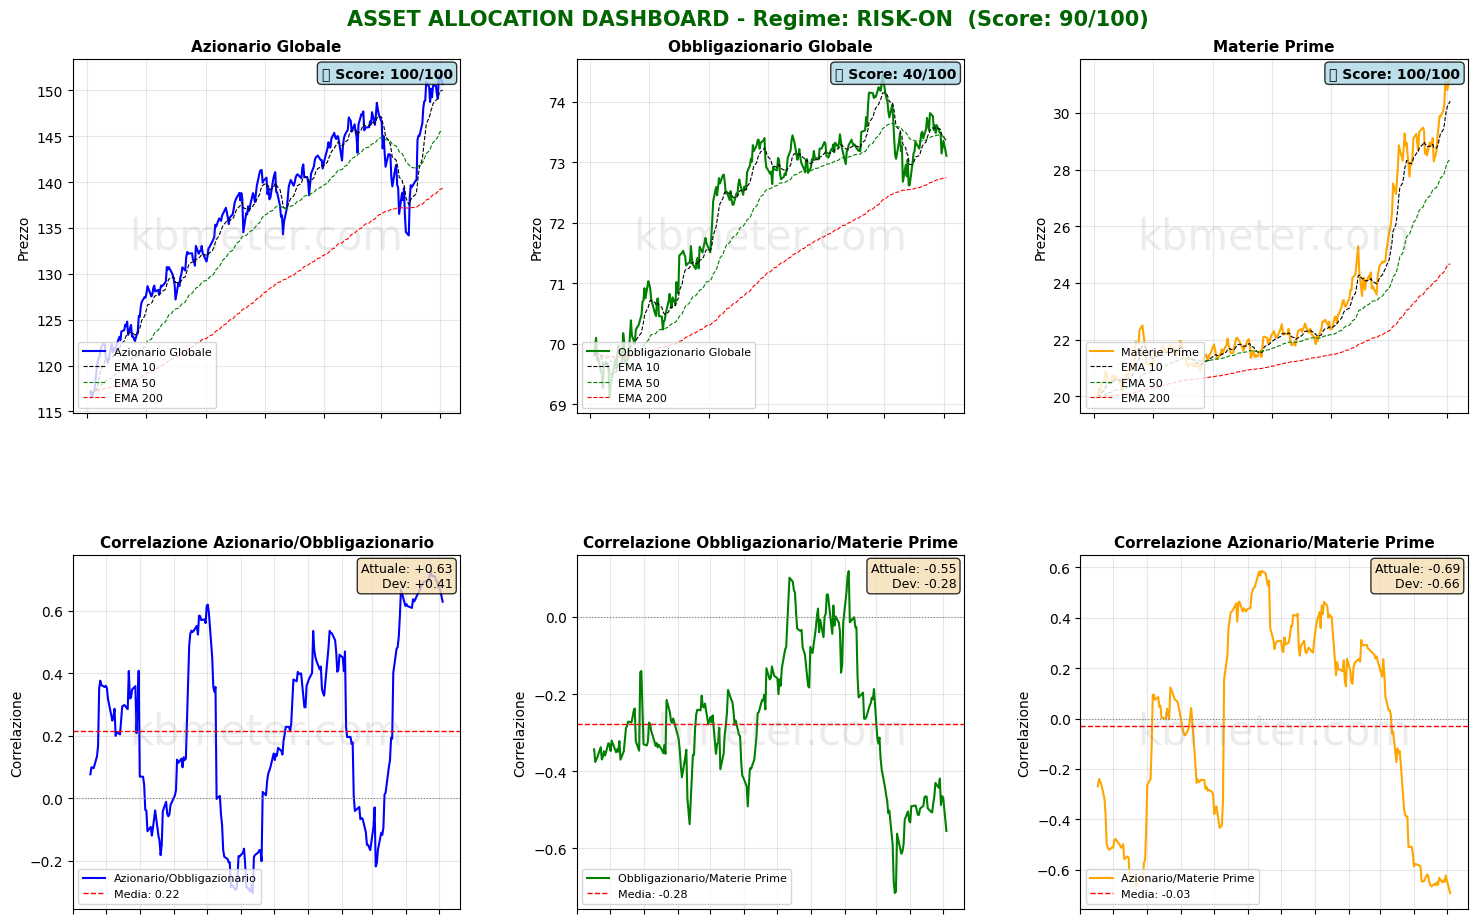
MARKET REGIME: RISK-ON
REGIME SCORE: 90.0/100
======================================================================
TREND AND VOLATILITY ANALYSIS
======================================================================
GLOBAL EQUITIES (ACWI):
Short-Term Trend (5d): +0.72% | ABOVE EMA 10
Medium-Term Trend (20d): +7.49% | ABOVE EMA 50
Long-Term Trend (60d): +3.02% | ABOVE EMA 200
Volatility 5d: 14.7%
Volatility 20d: 15.6%
Volatility 60d: 17.7%
COMMODITIES (DBC):
Medium-Term Trend (20d): +6.67% | ABOVE EMA 50
Volatility 20d: 22.1%
Correlation ACWI/BND (30d): 0.629
REGIME INTERPRETATION:
The market is in a risk-on regime. Equities show positive trends across multiple
time horizons and volatility remains contained. Investors favor risk assets.
Suggested positioning: OVERWEIGHT equities.
======================================================================
ASSET RANKING - WHO IS PERFORMING BEST?
======================================================================
🥇 1. Global Equities (ACWI) - SCORE: 100/100
Price: $150.70
Trend: ABOVE EMA10 | ABOVE EMA50 | ABOVE EMA200
Performance: 5d +0.72% | 20d +7.49% | 60d +3.02%
Volatility: 5d 14.7% | 20d 15.6% | 60d 17.7%
Drawdown: -0.63%
→ Asset in STRONG HEALTH: positive trends and controlled volatility
🥈 2. Commodities (DBC) - SCORE: 100/100
Price: $31.33
Trend: ABOVE EMA10 | ABOVE EMA50 | ABOVE EMA200
Performance: 5d +3.26% | 20d +6.67% | 60d +30.49%
Volatility: 5d 21.0% | 20d 22.1% | 60d 23.6%
Drawdown: 0.00%
→ Asset in STRONG HEALTH: positive trends and controlled volatility
🥉 3. Global Bonds (BND) - SCORE: 40/100
Price: $73.11
Trend: BELOW EMA10 | BELOW EMA50 | ABOVE EMA200
Performance: 5d -0.50% | 20d -0.31% | 60d -0.55%
Volatility: 5d 4.4% | 20d 3.5% | 60d 4.3%
Drawdown: -1.79%
→ Asset in WEAK conditions: negative trends or elevated volatility
======================================================================
CORRELATION ANALYSIS - CURRENT vs HISTORICAL
======================================================================
ACWI/BND:
Current correlation (30d): +0.629
Historical average (1 year): +0.215
Deviation: +0.414
⚠️ SIGNIFICANT DEVIATION from historical average
→ Positive correlation: diversification COMPROMISED
BND/DBC:
Current correlation (30d): -0.555
Historical average (1 year): -0.278
Deviation: -0.276
ACWI/DBC:
Current correlation (30d): -0.692
Historical average (1 year): -0.028
Deviation: -0.663
⚠️ SIGNIFICANT DEVIATION from historical average
→ Negative correlation: possible supply-driven shift
======================================================================
OPERATIONAL SUMMARY
======================================================================
STRONGEST ASSET: Global Equities (Score: 100/100)
WEAKEST ASSET: Global Bonds (Score: 40/100)
SUGGESTED ACTION: Favor the strongest asset, maintain risk exposure.
DIVERSIFICATION: WEAK - Asset classes tend to move together.
======================================================================
Analysis automatically generated by kbmeter.com
Date: 2026-05-05
Macroeconomic calendar
The macro calendar offers few but important highlights: the Australian central bank’s interest rate decision, U.S. job openings data for March, the April ISM Services index, and U.S. export data for March 2026.
On the earnings front, today features reports—among others—from AMD, Pfizer, Shopify, PayPal, and HSBC.
Already a subscriber? Login here
NOTES AND WARNINGS
Data compiled by kbmeter.com. Analysis date: 5 May 2026 - 7:44 AM GMT+1
This content is provided for informational purposes only and should not be considered financial advice. All scores and assessments are based on the previous trading day’s closing prices. Futures indications refer to the date and time of the analysis.