Financial markets head toward a risk-off end to the week
The week draws to a close on a distinctly nervous note for financial markets, with investors shifting into risk-off mode and selling down the technology sector, where profit expectations have become more uncertain amid rising AI-related costs. On the macro front, the release of US labour market data has been postponed to 13 February. Futures point to another weak opening for both European and US markets.
Market Weather Map
February 6, 2026
US Equities
Eu Equities
Asia Equities
Commodities
Bonds
Dollar Index
Technology
Gold
Oil
Crypto
Market Summary
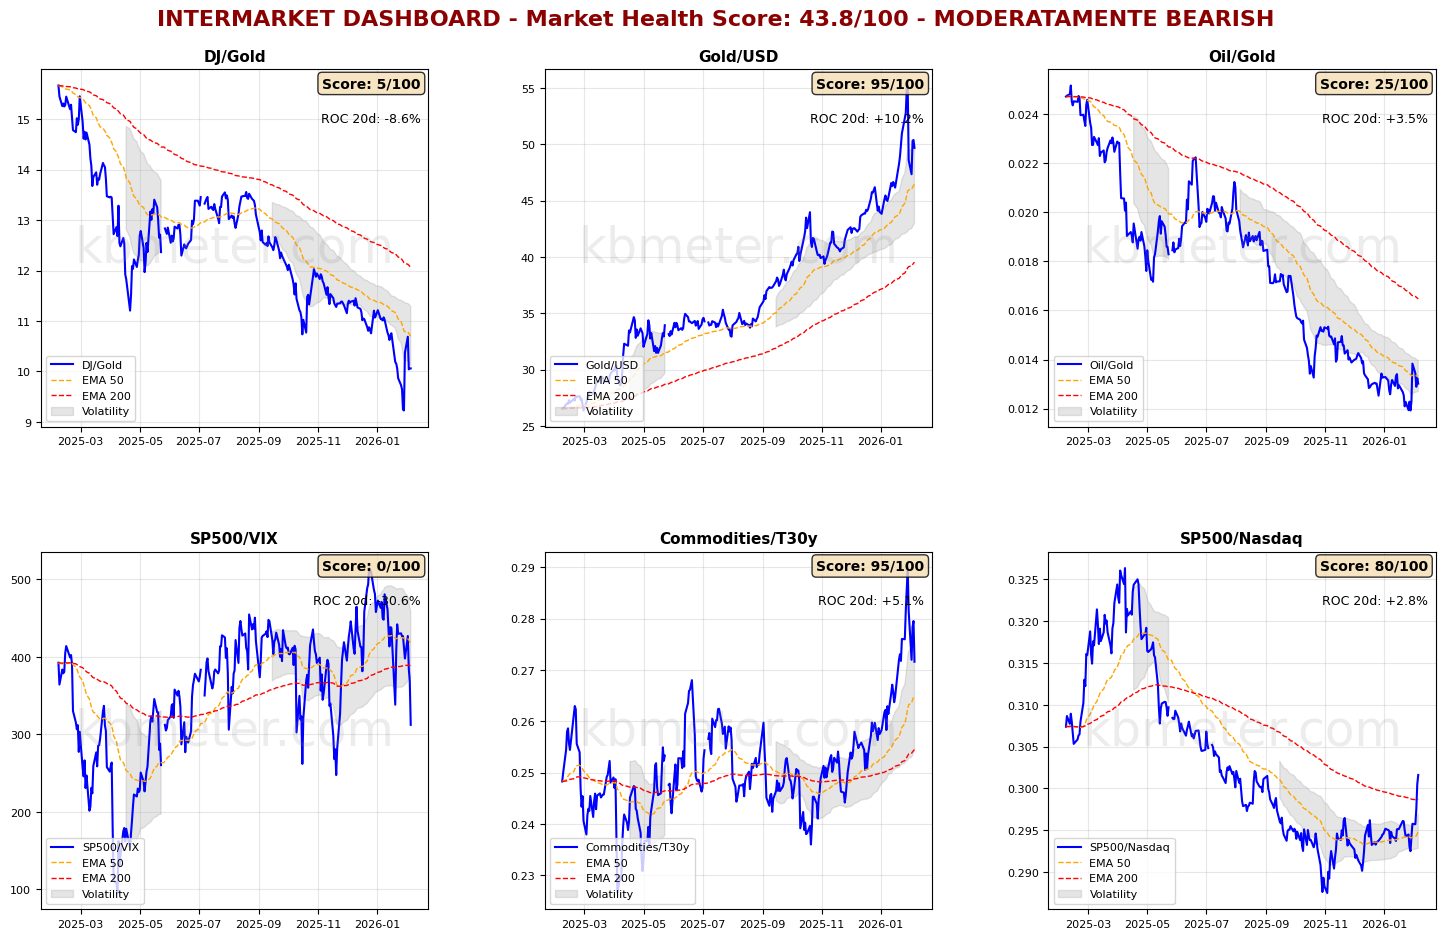
Market sentiment today is moderately negative. Intermarket analysis shows a Market Health Score of 44/100 (moderately bearish). Among the more noteworthy signals from our intermarket dashboards are developments in risk ratios: the S&P 500/VIX has fallen back to its November lows, while the S&P 500/Nasdaq has broken above its 200-day moving average, climbing to highs last seen at the end of last summer. The latter is a clear sign of the ongoing sector rotation in the US, with technology stocks (score 46.8/100) under heavy pressure. Another point of interest is gold, which appears to have lost momentum. Major asset classes are showing a marked slowdown in trend strength, with global equities resting on their medium-term moving average, bonds locked in an increasingly evident sideways phase, and commodities weighed down by heightened volatility — remarkably driven by precious metals.
Futures – Pre-Market: Global futures signal a moderate risk-off sentiment (average -0.05%), with the US slightly positive (+0.04%), Europe moderately negative (-0.19%) and Asia slightly positive (+0.25%).
📊 Global Futures – Pre-Market Sentiment
- TecDAX derived: +0.71%
- Hang Seng derived: +0.59%
- Russell 2000: +0.56%
- IBEX 35 derived: -1.81%
- FTSE MIB derived: -1.79%
- CSI 300: -0.35%
📄 Detailed Intermarket Analysis
INTERMARKET ANALYSIS - 2026-02-06
============================================================

MARKET HEALTH SCORE: 43.8/100
SENTIMENT: MODERATELY BEARISH

============================================================
SUMMARY OF KEY RATIOS
============================================================


DJ/Gold:
  - Component score: 5.0/100
  - Current value: 10.0606
  - Position vs EMA50: BELOW
  - 20-day ROC: -8.64%
  - 50-day ROC: -11.31%
  → Flight to safe havens

Gold/USD:
  - Component score: 95.0/100
  - Current value: 49.6974
  - Position vs EMA50: ABOVE
  - 20-day ROC: +10.22%
  - 50-day ROC: +22.13%

Oil/Gold:
  - Component score: 25.0/100
  - Current value: 0.0130
  - Position vs EMA50: BELOW
  - 20-day ROC: +3.46%
  - 50-day ROC: -8.59%
  → Rising energy demand

SP500/VIX:
  - Component score: 0.0/100
  - Current value: 312.2829
  - Position vs EMA50: BELOW
  - 20-day ROC: -30.60%
  - 50-day ROC: +10.81%
  - ⚠️ ANOMALY DETECTED - Significant deviation from the mean
  → Contracting risk appetite

Commodities/T30y:
  - Component score: 95.0/100
  - Current value: 0.2716
  - Position vs EMA50: ABOVE
  - 20-day ROC: +5.15%
  - 50-day ROC: +10.28%
  → Economic growth expectations

SP500/Nasdaq:
  - Component score: 80.0/100
  - Current value: 0.3016
  - Position vs EMA50: ABOVE
  - 20-day ROC: +2.78%
  - 50-day ROC: +1.74%
  - ⚠️ ANOMALY DETECTED - Significant deviation from the mean

============================================================
CONCLUSIONS AND RECOMMENDATIONS
============================================================

The market shows signs of weakness. Several ratios are in negative territory.
Risk appetite is declining. Increase caution.
Positioning: DEFENSIVE, favor safe havens.


STRONGEST RATIOS:
  • Gold/USD: 95.0/100
  • Commodities/T30y: 95.0/100
  • SP500/Nasdaq: 80.0/100

WEAKEST RATIOS:
  • Oil/Gold: 25.0/100
  • DJ/Gold: 5.0/100
  • SP500/VIX: 0.0/100

============================================================
Analysis automatically generated by kbmeter.com
Date: 2026-02-06
📄 Detailed Asset Allocation Analysis
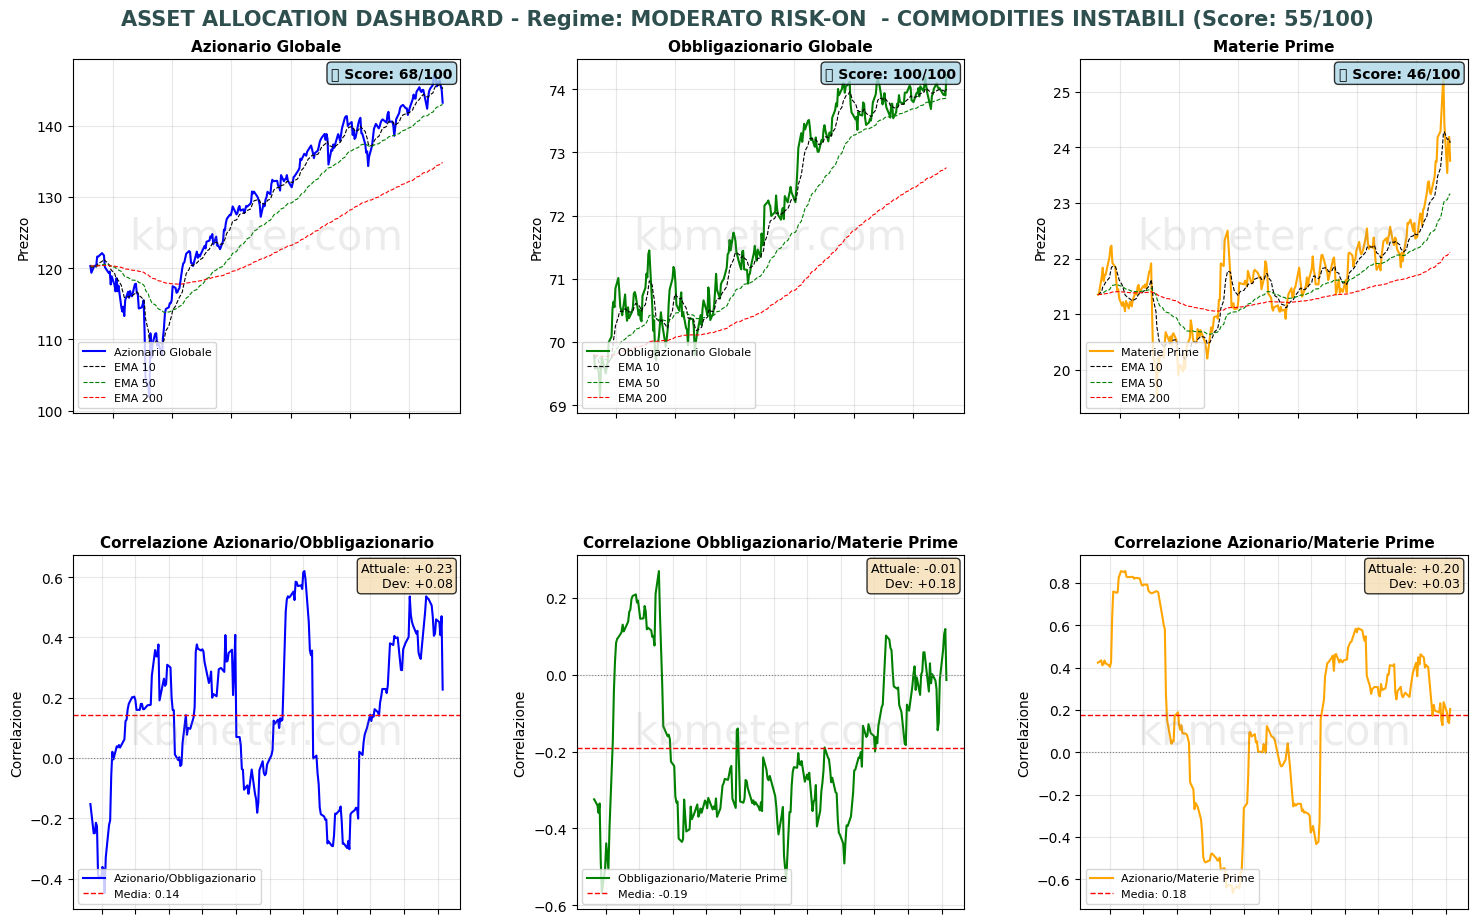
ASSET ALLOCATION & REGIME ANALYSIS - 2026-02-06
======================================================================

MARKET REGIME: MODERATE RISK-ON – UNSTABLE COMMODITIES
REGIME SCORE: 55.0/100

======================================================================
TREND AND VOLATILITY ANALYSIS
======================================================================

GLOBAL EQUITIES (ACWI):
  Short-Term Trend (5d): -1.57% | BELOW EMA 10
  Medium-Term Trend (20d): -0.39% | ABOVE EMA 50
  Long-Term Trend (60d): +2.04% | ABOVE EMA 200

  Volatility 5d: 10.5%
  Volatility 20d: 11.4%
  Volatility 60d: 11.3%

COMMODITIES (DBC):
  Medium-Term Trend (20d): +3.85% | ABOVE EMA 50
  Volatility 20d: 25.9%

ACWI/BND Correlation (30d): 0.227

REGIME INTERPRETATION:
The market shows a propensity for risk, albeit with some elements of caution.
The trend remains constructive, though mixed signals may emerge across
different time horizons.
Suggested positioning: BALANCED, with a slight tilt toward risk assets.

⚠️ COMMODITIES ALERT: Commodities are showing elevated volatility. This may
signal uncertainty around economic growth or unstable supply/demand dynamics.

======================================================================
ASSET RANKING – WHO IS PERFORMING BEST?
======================================================================

🥇 1. Global Bonds (BND) - SCORE: 100/100
     Price: $74.22
     Trend: ABOVE EMA10 | ABOVE EMA50 | ABOVE EMA200
     Performance: 5d +0.32% | 20d +0.45% | 60d +0.87%
     Volatility: 5d 3.4% | 20d 2.9% | 60d 2.8%
     Drawdown: 0.00%
     → Asset in STRONG HEALTH: positive trends and controlled volatility

🥈 2. Global Equities (ACWI) - SCORE: 68/100
     Price: $143.21
     Trend: BELOW EMA10 | ABOVE EMA50 | ABOVE EMA200
     Performance: 5d -1.57% | 20d -0.39% | 60d +2.04%
     Volatility: 5d 10.5% | 20d 11.4% | 60d 11.3%
     Drawdown: -2.62%
     → Asset in FAIR CONDITION: predominantly positive signals

🥉 3. Commodities (DBC) - SCORE: 46/100
     Price: $23.76
     Trend: BELOW EMA10 | ABOVE EMA50 | ABOVE EMA200
     Performance: 5d -2.74% | 20d +3.85% | 60d +6.09%
     Volatility: 5d 41.7% | 20d 25.9% | 60d 18.3%
     Drawdown: -6.09%
     → Asset in NEUTRAL CONDITION: mixed signals

======================================================================
CORRELATION ANALYSIS – CURRENT vs HISTORICAL
======================================================================

ACWI/BND:
  Current correlation (30d): +0.227
  Historical average (1 year): +0.144
  Deviation: +0.083
  → Weak correlation: moderate diversification

BND/DBC:
  Current correlation (30d): -0.013
  Historical average (1 year): -0.190
  Deviation: +0.177

ACWI/DBC:
  Current correlation (30d): +0.205
  Historical average (1 year): +0.176
  Deviation: +0.028

======================================================================
OPERATIONAL SUMMARY
======================================================================

STRONGEST ASSET: Global Bonds (Score: 100/100)
WEAKEST ASSET: Commodities (Score: 46/100)

SUGGESTED ACTION: Balanced approach, diversify across asset classes.
DIVERSIFICATION: EXCELLENT – Asset classes are moving independently.

======================================================================
Analysis automatically generated by kbmeter.com
Date: 2026-02-06
On the macro calendar, in the absence of official US employment data, attention turns to German industrial production for December 2025, export data from France and Germany at year-end 2025, Canadian employment figures for January, and the preliminary February 2026 reading of the University of Michigan consumer sentiment index.
On the earnings front, results from Toyota and Philip Morris are due today.
Already a subscriber? Login here
NOTES AND WARNINGS
Data compiled by kbmeter.com. Analysis date: 6 February 2026 - 7:40 AM GMT+1
This content is provided for informational purposes only and should not be considered financial advice. All scores and assessments are based on the previous trading day’s closing prices. Futures indications refer to the date and time of the analysis.