Financial markets end the week — and January 2026 — under a cloud of uncertainty
The week draws to a close confirming the climate of uncertainty that has marked much of January 2026. The key themes remain unchanged: the outlook for the Federal Reserve, ongoing geopolitical risks, and lingering doubts over the profitability of artificial intelligence — with Microsoft bearing the brunt of those concerns in the latest session.
Against this backdrop, precious metals continue to show strength, while the dollar and equities remain under pressure. Oil is showing tentative signs of recovery. Overall sentiment stays neutral to mildly negative.
Futures offer little hope of a change in direction for today’s session, pointing to lower openings for both European and U.S. markets.
Market Weather Map
January 30, 2026
US Equities
Eu Equities
Asia Equities
Commodities
Bonds
Dollar Index
Technology
Gold
Oil
Crypto
Market Summary
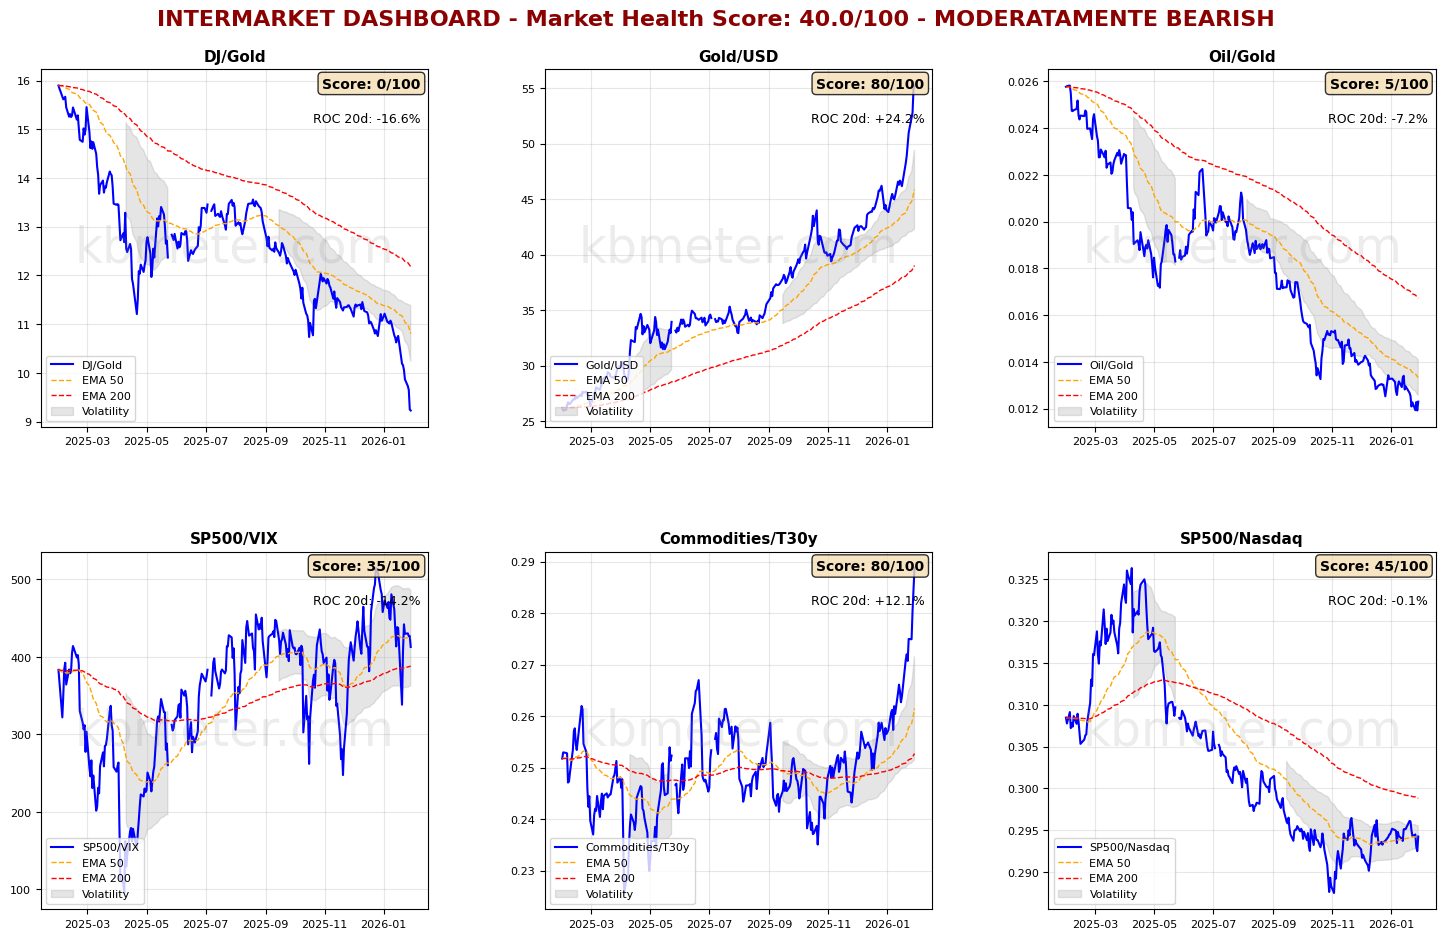
Financial markets currently reflect a neutral to slightly negative tone. Intermarket analysis places the Market Health Score at 40/100, indicating a moderately negative environment.
Intermarket dashboards continue to depict a landscape marked by uncertainty. Gold maintains its dominance versus both the dollar and the Dow, while oil shows early signs of stabilization and risk indicators remain weak. The three major asset classes continue to confirm their medium-term trends, though the short-term picture has become more uneven. Equities and bonds are losing momentum, while commodities surge, driven primarily by metals — both precious and industrial.
Pre-Market Futures: Global futures point to a moderate risk-off tone (average -0.38%), with U.S. markets leading to the downside (-0.76%), Europe modestly lower (-0.28%), and Asia slightly weaker (-0.15%).
📊 Global Futures – Pre-Market Sentiment
- CSI 300: +0.76%
- Euro Stoxx 50 derived: +0.53%
- Mini DAX: +0.50%
- TecDAX derived: -3.60%
- Hang Seng derived: -1.36%
- Russell 2000: -1.00%
📄 Detailed Intermarket Analysis
INTERMARKET ANALYSIS - 2026-01-30
============================================================

MARKET HEALTH SCORE: 40.0/100
SENTIMENT: MODERATELY BEARISH

============================================================
SUMMARY OF KEY RATIOS
============================================================


DJ/Gold:
  - Component score: 0.0/100
  - Current value: 9.2268
  - Position vs EMA50: BELOW
  - 20-day ROC: -16.63%
  - 50-day ROC: -20.01%
  - ⚠️ ANOMALY DETECTED – Significant deviation from the mean
  → Flight to safe havens

Gold/USD:
  - Component score: 80.0/100
  - Current value: 55.2389
  - Position vs EMA50: ABOVE
  - 20-day ROC: +24.18%
  - 50-day ROC: +34.15%
  - ⚠️ ANOMALY DETECTED – Significant deviation from the mean

Oil/Gold:
  - Component score: 5.0/100
  - Current value: 0.0123
  - Position vs EMA50: BELOW
  - 20-day ROC: -7.24%
  - 50-day ROC: -16.32%
  → Weakening energy demand

SP500/VIX:
  - Component score: 35.0/100
  - Current value: 412.8560
  - Position vs EMA50: BELOW
  - 20-day ROC: -14.21%
  - 50-day ROC: +21.57%
  → Contracting risk appetite

Commodities/T30y:
  - Component score: 80.0/100
  - Current value: 0.2887
  - Position vs EMA50: ABOVE
  - 20-day ROC: +12.06%
  - 50-day ROC: +14.62%
  - ⚠️ ANOMALY DETECTED – Significant deviation from the mean
  → Economic growth expectations

SP500/Nasdaq:
  - Component score: 45.0/100
  - Current value: 0.2942
  - Position vs EMA50: ABOVE
  - 20-day ROC: -0.08%
  - 50-day ROC: +0.06%

============================================================
CONCLUSIONS AND RECOMMENDATIONS
============================================================

The market shows signs of weakness. Several ratios are in negative territory.
Risk appetite is declining. Increase caution.
Positioning: DEFENSIVE, favor safe-haven assets.


STRONGEST RATIOS:
  • Gold/USD: 80.0/100
  • Commodities/T30y: 80.0/100
  • SP500/Nasdaq: 45.0/100

WEAKEST RATIOS:
  • SP500/VIX: 35.0/100
  • Oil/Gold: 5.0/100
  • DJ/Gold: 0.0/100

============================================================
Analysis automatically generated by kbmeter.com
Date: 2026-01-30
📄 Detailed Asset Allocation Analysis
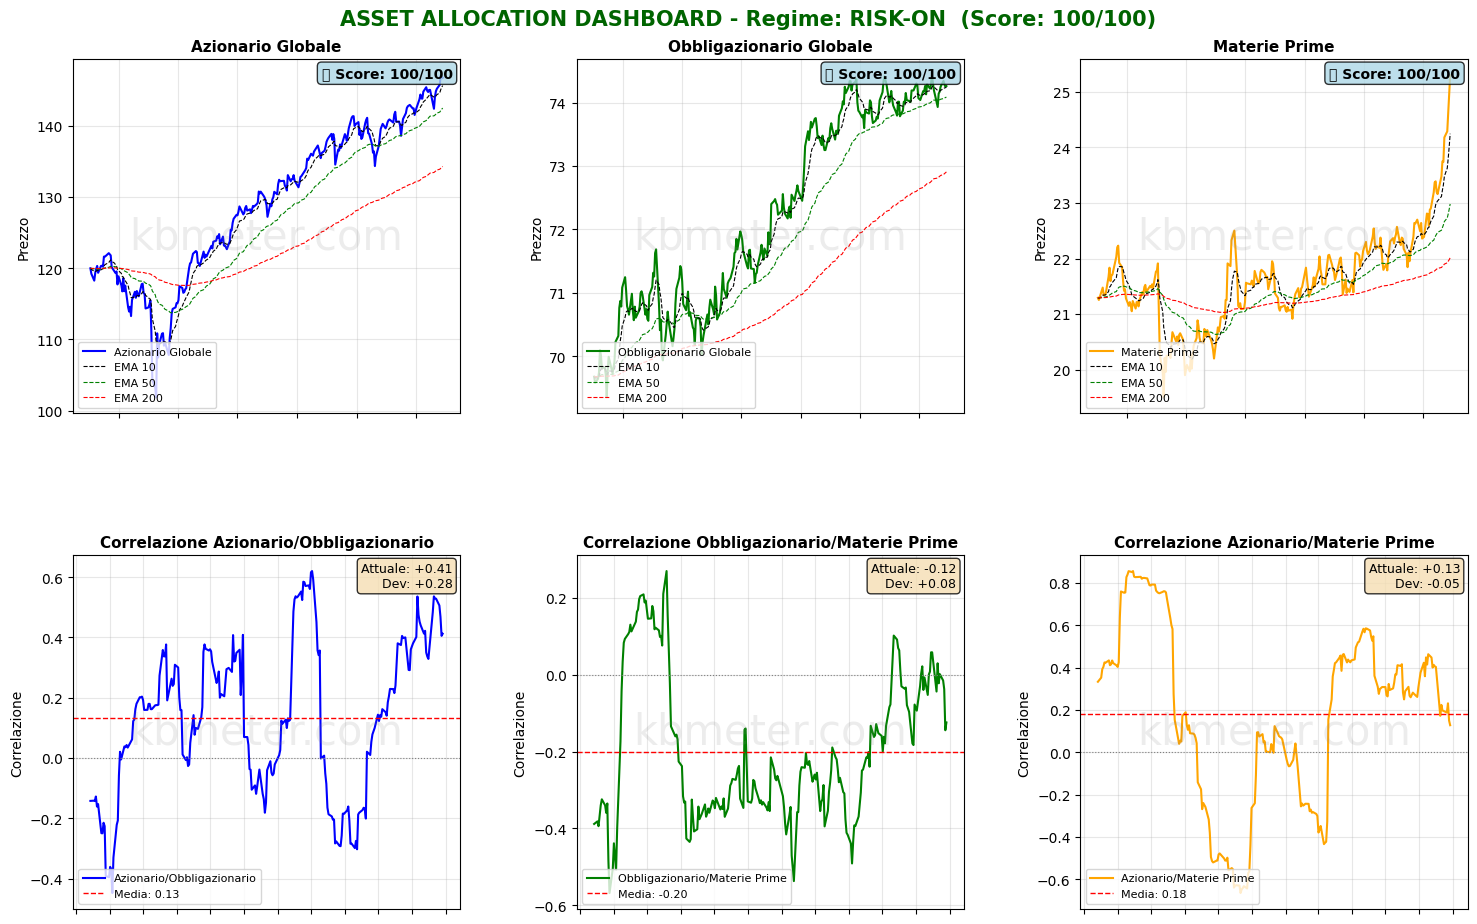
ASSET ALLOCATION & REGIME ANALYSIS - 2026-01-30 ======================================================================MARKET REGIME: RISK-ON REGIME SCORE: 100.0/100====================================================================== TREND AND VOLATILITY ANALYSIS ======================================================================GLOBAL EQUITIES (ACWI): Short-Term Trend (5d): +1.06% | ABOVE EMA 10 Medium-Term Trend (20d): +3.68% | ABOVE EMA 50 Long-Term Trend (60d): +4.42% | ABOVE EMA 200 Volatility 5d: 6.9% Volatility 20d: 10.6% Volatility 60d: 11.2%COMMODITIES (DBC): Medium-Term Trend (20d): +13.15% | ABOVE EMA 50 Volatility 20d: 14.9%ACWI/BND Correlation (30d): 0.412REGIME INTERPRETATION: The market is in a risk-on regime. Equities show positive trends across multiple time horizons and volatility remains contained. Investors favor risky assets. Suggested positioning: OVERWEIGHT equities.====================================================================== ASSET RANKING – WHO IS PERFORMING BEST? ======================================================================🥇 1. Global Equities (ACWI) - SCORE: 100/100 Price: $146.70 Trend: ABOVE EMA10 | ABOVE EMA50 | ABOVE EMA200 Performance: 5d +1.06% | 20d +3.68% | 60d +4.42% Volatility: 5d 6.9% | 20d 10.6% | 60d 11.2% Drawdown: -0.24% → Asset in STRONG HEALTH: positive trends and controlled volatility🥈 2. Global Bonds (BND) - SCORE: 100/100 Price: $74.26 Trend: ABOVE EMA10 | ABOVE EMA50 | ABOVE EMA200 Performance: 5d +0.01% | 20d +0.26% | 60d +0.67% Volatility: 5d 1.4% | 20d 2.7% | 60d 2.8% Drawdown: -0.23% → Asset in STRONG HEALTH: positive trends and controlled volatility🥉 3. Commodities (DBC) - SCORE: 100/100 Price: $25.30 Trend: ABOVE EMA10 | ABOVE EMA50 | ABOVE EMA200 Performance: 5d +4.63% | 20d +13.15% | 60d +13.46% Volatility: 5d 8.1% | 20d 14.9% | 60d 13.4% Drawdown: 0.00% → Asset in STRONG HEALTH: positive trends and controlled volatility====================================================================== CORRELATION ANALYSIS – CURRENT vs HISTORICAL ======================================================================ACWI/BND: Current correlation (30d): +0.412 Historical average (1 year): +0.132 Deviation: +0.281 → Positive correlation: diversification IMPAIREDBND/DBC: Current correlation (30d): -0.124 Historical average (1 year): -0.200 Deviation: +0.076ACWI/DBC: Current correlation (30d): +0.128 Historical average (1 year): +0.181 Deviation: -0.053====================================================================== OPERATIONAL SUMMARY ======================================================================STRONGEST ASSET: Global Equities (Score: 100/100) WEAKEST ASSET: Commodities (Score: 100/100)SUGGESTED ACTION: Favor the strongest asset, maintain risk exposure. DIVERSIFICATION: EXCELLENT – Asset classes move largely independently.====================================================================== Analysis automatically generated by kbmeter.com Date: 2026-01-30 <On the macro front, the day’s agenda includes data on euro-area economic activity in the fourth quarter of 2025. Markets will also focus on January 2026 inflation figures for the Eurozone, Japan’s industrial production at the end of 2025, and U.S. producer price data for December 2025.
On the earnings front, attention turns to several major players from the “old economy.” Notable releases include Exxon Mobil, Colgate-Palmolive, American Express, Chevron, Imperial Oil and Aon.
Already a subscriber? Login here
NOTES AND WARNINGS
Analysis automatically generated by kbmeter.com. Analysis date: 30 January 2026 - 7:51 AM GMT+1
This content is provided for informational purposes only and should not be considered financial advice. All scores and assessments are based on the previous trading day’s closing prices. Futures indications refer to the date and time of the analysis.