Financial Markets Caught Between Inflation Risks and Tech Sector Optimism
Inflation and the technology sector are the two key themes driving financial markets at the start of this week. With oil prices remaining elevated, investors are increasing pressure on the bond market, while also assessing the potential impact of the energy shock on public finances. On the other hand, anticipation is building for Nvidia’s quarterly earnings release (due tomorrow), and appetite for the technology sector remains strong. Against this backdrop, the risk-on environment is holding up, although showing signs of weakening. Futures point to a slightly positive opening for Europe and a slightly negative opening for the United States.
Market Weather Map
May 19, 2026
US Equities
Eu Equities
Asia Equities
Commodities
Bonds
Dollar Index
Technology
Gold
Oil
Crypto
Market Summary
Financial markets sentiment
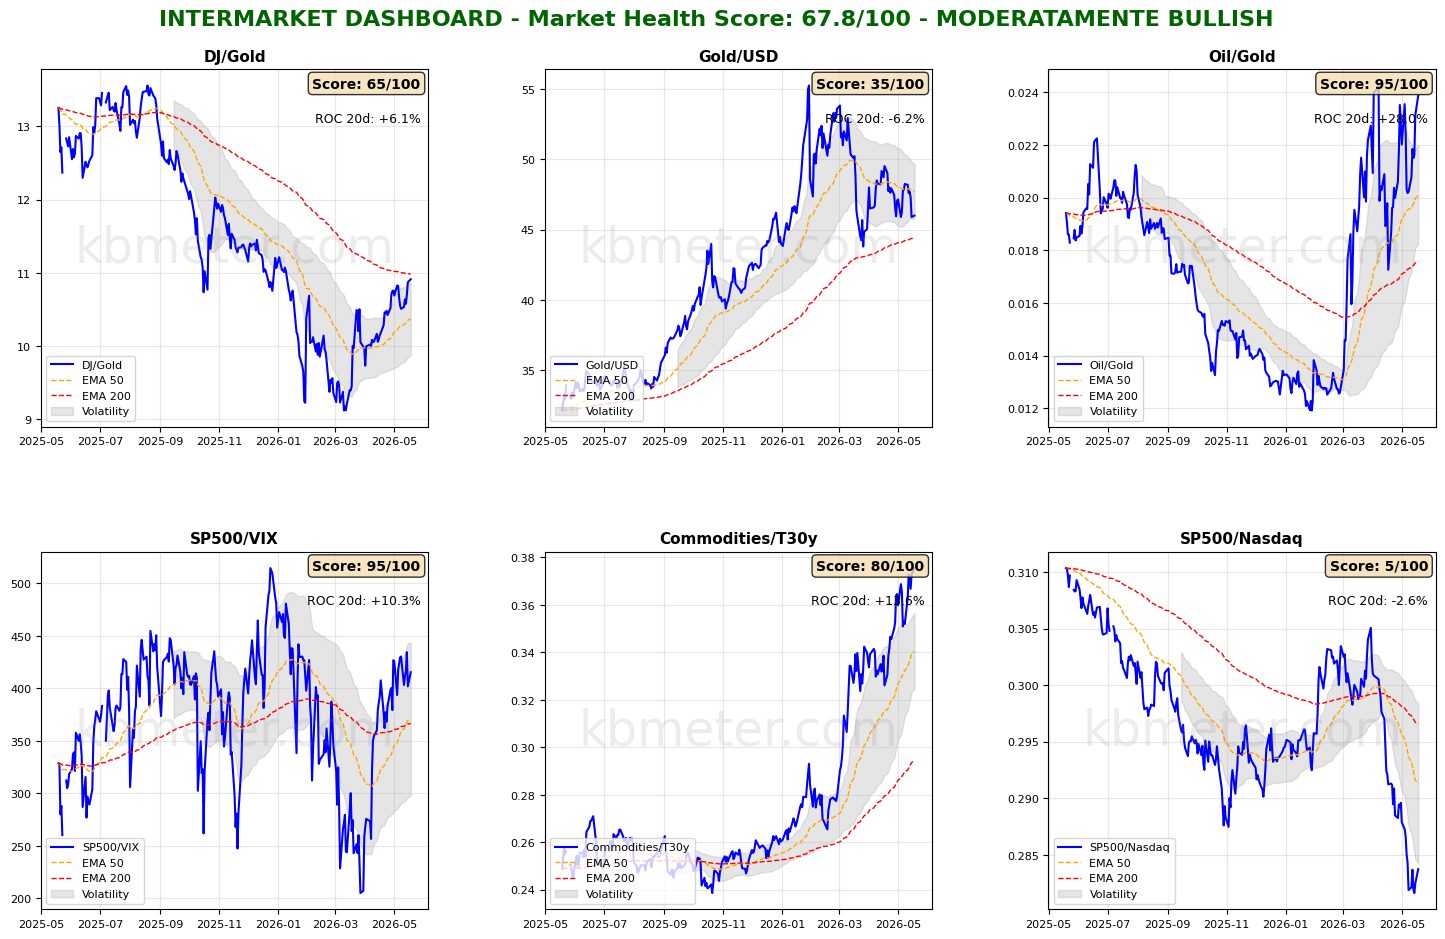
Financial markets are currently showing a neutral to moderately positive sentiment. Intermarket analysis indicates a Market Health Score of 68/100 (moderately positive). Our intermarket dashboards highlight the two major themes dividing financial markets in recent weeks. On one side, inflation risk remains elevated (the oil/gold ratio has returned to period highs, the commodities/bonds ratio remains at period highs, and the dollar is recovering against gold). On the other side, optimism surrounding the technology sector continues to support equities, while the S&P 500/Nasdaq ratio remains near period lows. This creates a “stalled” situation as markets await Nvidia’s earnings results and concrete developments from the Middle East front.
Meanwhile, the global bond market remains around its long-term moving average and near period lows. This is a risky situation, but it could also provide the starting point for a rebound, at least from a technical perspective. Global equities are also slowing, although they remain in an upward trend.
Our market weather map clearly illustrates the current environment: the tech sector is approaching a 70-point health score, oil and the dollar are both above 60 points, while bonds are underperforming, surpassed on the downside only by cryptocurrencies.
Global Futures – Pre-Market Sentiment
Pre-Market Futures: Global futures are signaling a moderate risk-off sentiment (average +0.00%), with the US slightly negative (-0.31%), Europe slightly positive (+0.29%), and Asia slightly negative (-0.46%).
📊 Global Futures – Pre-Market Sentiment
- TecDAX derived: +1.57%
- IBEX 35 derived: +0.97%
- Hang Seng derived: +0.54%
- Nikkei 225 derived: -1.32%
- CSI 300: -0.60%
- US Tech 100 derived: -0.42%
Intermarket details
📄 Detailed Intermarket Analysis
INTERMARKET ANALYSIS - 2026-05-19
============================================================

MARKET HEALTH SCORE: 67.8/100
SENTIMENT: MODERATELY BULLISH

============================================================
SUMMARY OF MAIN RATIOS
============================================================


DJ/Gold:
  - Component score: 65.0/100
  - Current value: 10.9140
  - Position vs EMA50: ABOVE
  - 20-day ROC: +6.10%
  - 50-day ROC: +18.24%
  → Preference for risky assets vs safe havens

Gold/USD:
  - Component score: 35.0/100
  - Current value: 45.9988
  - Position vs EMA50: BELOW
  - 20-day ROC: -6.17%
  - 50-day ROC: -11.52%

Oil/Gold:
  - Component score: 95.0/100
  - Current value: 0.0239
  - Position vs EMA50: ABOVE
  - 20-day ROC: +28.03%
  - 50-day ROC: +35.12%
  → Growing energy demand

SP500/VIX:
  - Component score: 95.0/100
  - Current value: 415.4349
  - Position vs EMA50: ABOVE
  - 20-day ROC: +10.27%
  - 50-day ROC: +81.77%
  → Expanding risk appetite

Commodities/T30y:
  - Component score: 80.0/100
  - Current value: 0.3755
  - Position vs EMA50: ABOVE
  - 20-day ROC: +13.60%
  - 50-day ROC: +19.83%
  - ⚠️ ANOMALY DETECTED - Significant deviation from the average
  → Expectations of economic growth

SP500/Nasdaq:
  - Component score: 5.0/100
  - Current value: 0.2837
  - Position vs EMA50: BELOW
  - 20-day ROC: -2.60%
  - 50-day ROC: -5.75%

============================================================
CONCLUSIONS AND RECOMMENDATIONS
============================================================

The market remains moderately constructive. Some ratios are showing positive signals,
but cautionary elements persist. Monitor developments closely.
Positioning: SELECTIVE, favor quality.


STRONGEST RATIOS:
  • Oil/Gold: 95.0/100
  • SP500/VIX: 95.0/100
  • Commodities/T30y: 80.0/100

WEAKEST RATIOS:
  • DJ/Gold: 65.0/100
  • Gold/USD: 35.0/100
  • SP500/Nasdaq: 5.0/100

============================================================
Data processed by kbmeter.com
Date: 2026-05-19
📄 Detailed Asset Allocation Analysis
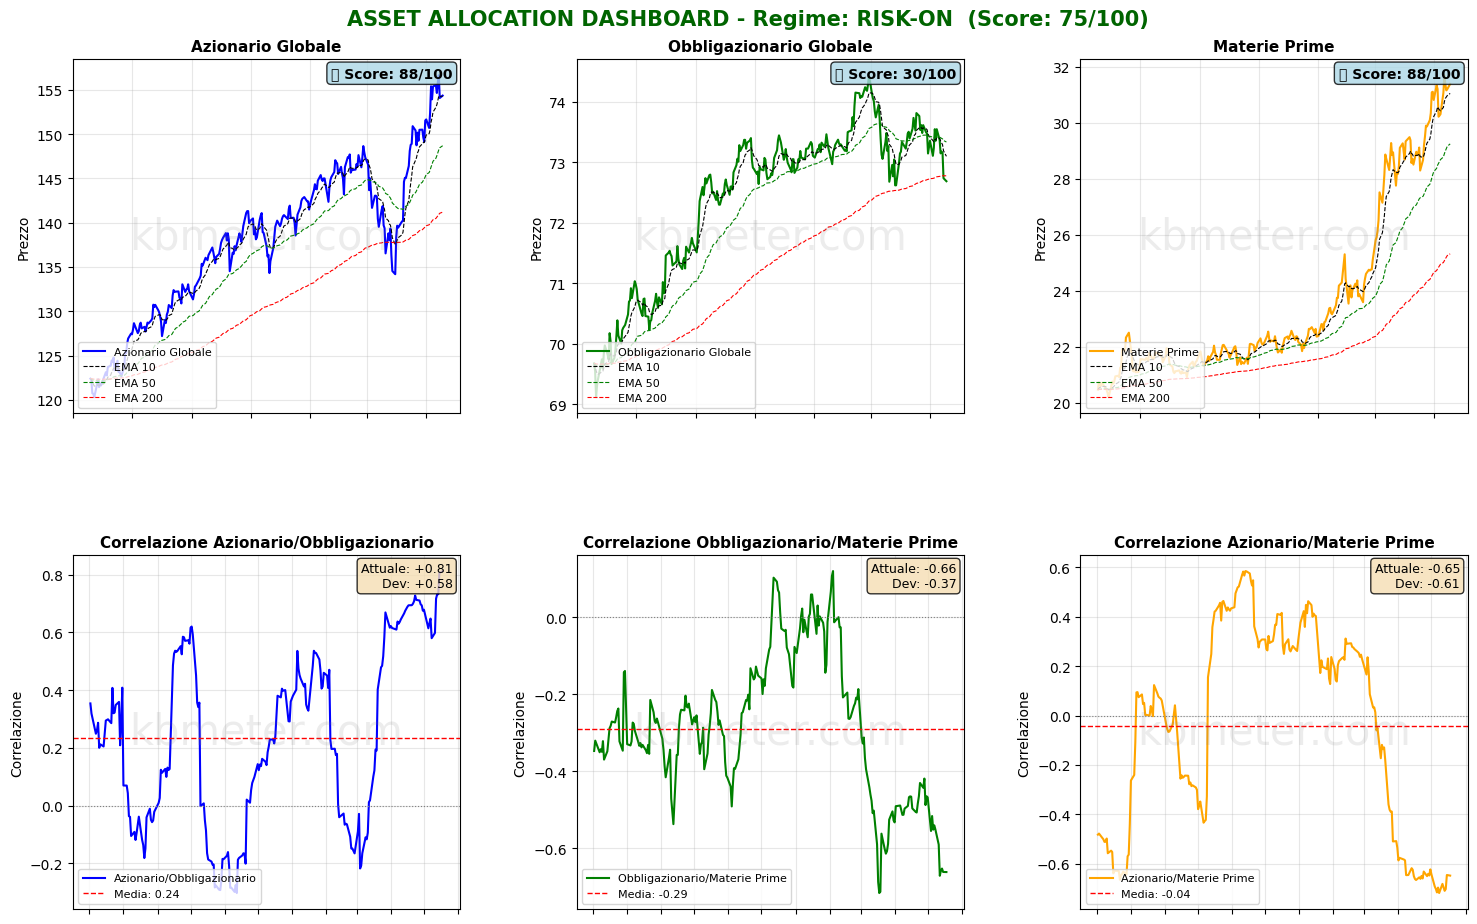
ASSET ALLOCATION & REGIME ANALYSIS - 2026-05-19
======================================================================

MARKET REGIME: RISK-ON
REGIME SCORE: 75.0/100

======================================================================
TREND AND VOLATILITY ANALYSIS
======================================================================

GLOBAL EQUITIES (ACWI):
  Short-Term Trend (5d): -0.19% | ABOVE EMA 10
  Medium-Term Trend (20d): +3.77% | ABOVE EMA 50
  Long-Term Trend (60d): +5.53% | ABOVE EMA 200

  5d Volatility: 15.5%
  20d Volatility: 15.1%
  60d Volatility: 18.0%

COMMODITIES (DBC):
  Medium-Term Trend (20d): +7.43% | ABOVE EMA 50
  20d Volatility: 21.7%

ACWI/BND Correlation (30d): 0.812

REGIME INTERPRETATION:
The market is currently in a risk-on regime. Equities are showing positive trends
across multiple time horizons, while volatility remains contained. Investors are favoring risky assets.
Suggested positioning: OVERWEIGHT equities.

======================================================================
ASSET RANKING - WHO IS PERFORMING BEST?
======================================================================

🥇 1. Global Equities (ACWI) - SCORE: 88/100
     Price: $154.35
     Trend: ABOVE EMA10 | ABOVE EMA50 | ABOVE EMA200
     Performance: 5d -0.19% | 20d +3.77% | 60d +5.53%
     Volatility: 5d 15.5% | 20d 15.1% | 60d 18.0%
     Drawdown: -1.47%
     → Asset in STRONG HEALTH: positive trends and controlled volatility

🥈 2. Commodities (DBC) - SCORE: 88/100
     Price: $31.38
     Trend: ABOVE EMA10 | ABOVE EMA50 | ABOVE EMA200
     Performance: 5d -0.98% | 20d +7.43% | 60d +26.79%
     Volatility: 5d 19.1% | 20d 21.7% | 60d 24.2%
     Drawdown: -0.98%
     → Asset in STRONG HEALTH: positive trends and controlled volatility

🥉 3. Global Bonds (BND) - SCORE: 30/100
     Price: $72.69
     Trend: BELOW EMA10 | BELOW EMA50 | BELOW EMA200
     Performance: 5d -0.63% | 20d -1.15% | 60d -2.09%
     Volatility: 5d 4.0% | 20d 4.1% | 60d 4.5%
     Drawdown: -2.35%
     → Asset in WEAK CONDITIONS: negative trends or elevated volatility

======================================================================
CORRELATION ANALYSIS - CURRENT vs HISTORICAL
======================================================================

ACWI/BND:
  Current Correlation (30d): +0.812
  Historical Average (1 year): +0.236
  Deviation: +0.577
  ⚠️ SIGNIFICANT DEVIATION from historical average
  → Positive correlation: diversification COMPROMISED

BND/DBC:
  Current Correlation (30d): -0.661
  Historical Average (1 year): -0.290
  Deviation: -0.372
  ⚠️ SIGNIFICANT DEVIATION from historical average

ACWI/DBC:
  Current Correlation (30d): -0.648
  Historical Average (1 year): -0.041
  Deviation: -0.606
  ⚠️ SIGNIFICANT DEVIATION from historical average
  → Negative correlation: possible supply-driven shift

======================================================================
OPERATIONAL SUMMARY
======================================================================

STRONGEST ASSET: Global Equities (Score: 88/100)
WEAKEST ASSET: Global Bonds (Score: 30/100)

SUGGESTED ACTION: Favor the strongest asset while maintaining risk exposure.
DIVERSIFICATION: POOR - Asset classes tend to move together.

======================================================================
Data processed by kbmeter.com
Date: 2026-05-19
Macroeconomic calendar
On the macroeconomic front, today’s agenda includes data on Japan’s Q1 2026 GDP performance, UK employment figures for the first three months of the year, and Canadian inflation data for April 2026.
Already a subscriber? Login here
NOTES AND WARNINGS
Data compiled by kbmeter.com. Analysis date: 19 May 2026 - 7:32 AM GMT+1
This content is provided for informational purposes only and should not be considered financial advice. All scores and assessments are based on the previous trading day’s closing prices. Futures indications refer to the date and time of the analysis.