Financial Markets Await Central Banks, Heavyweight Earnings Reports
Financial markets remain in a neutral zone. Sentiment is still tilted toward risk-on, but uncertainty surrounding the negotiations between the US and Iran, along with anticipation ahead of central bank decisions and earnings releases, is keeping investors on hold; the result is a sort of standstill. Futures point to a flat open for both Europe and the United States.
Market Weather Map
April 28, 2026
US Equities
Eu Equities
Asia Equities
Commodities
Bonds
Dollar Index
Technology
Gold
Oil
Crypto
Market Summary
Financial markets sentiment
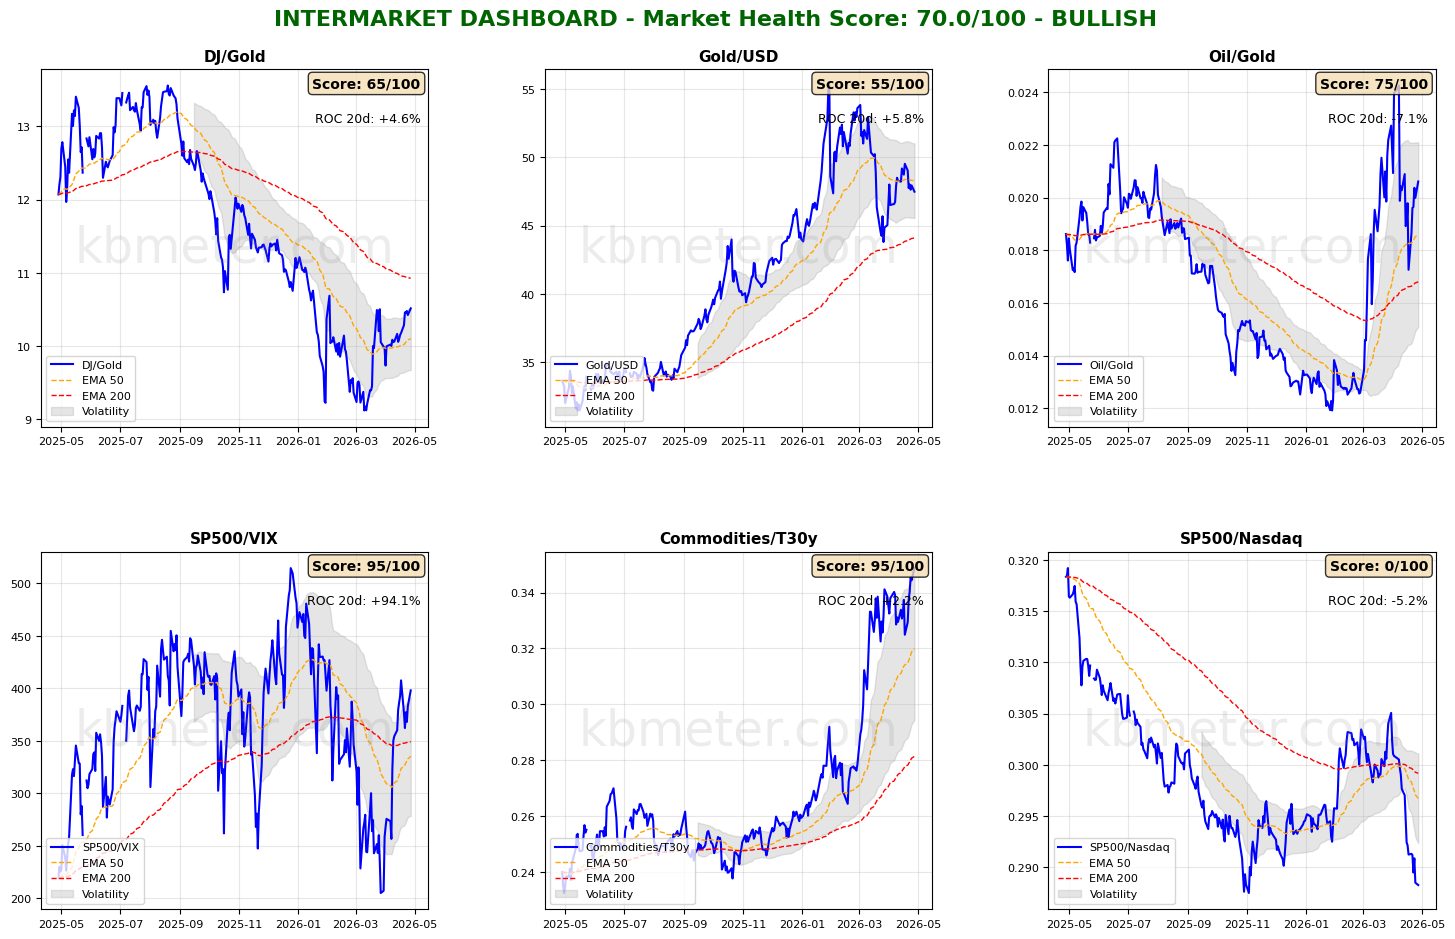
Financial markets are showing a neutral sentiment today. Intermarket analysis highlights a Market Health Score of 70/100 (positive). Our intermarket dashboards continue to signal a situation of substantial stalemate: on one hand, risk appetite indicators remain in positive territory; on the other, oil is regaining ground versus gold, while the Commodities / T30 ratio remains compressed near its highs. In other words, the market’s existing risk-on potential is currently being restrained by inflation expectations that could threaten demand.
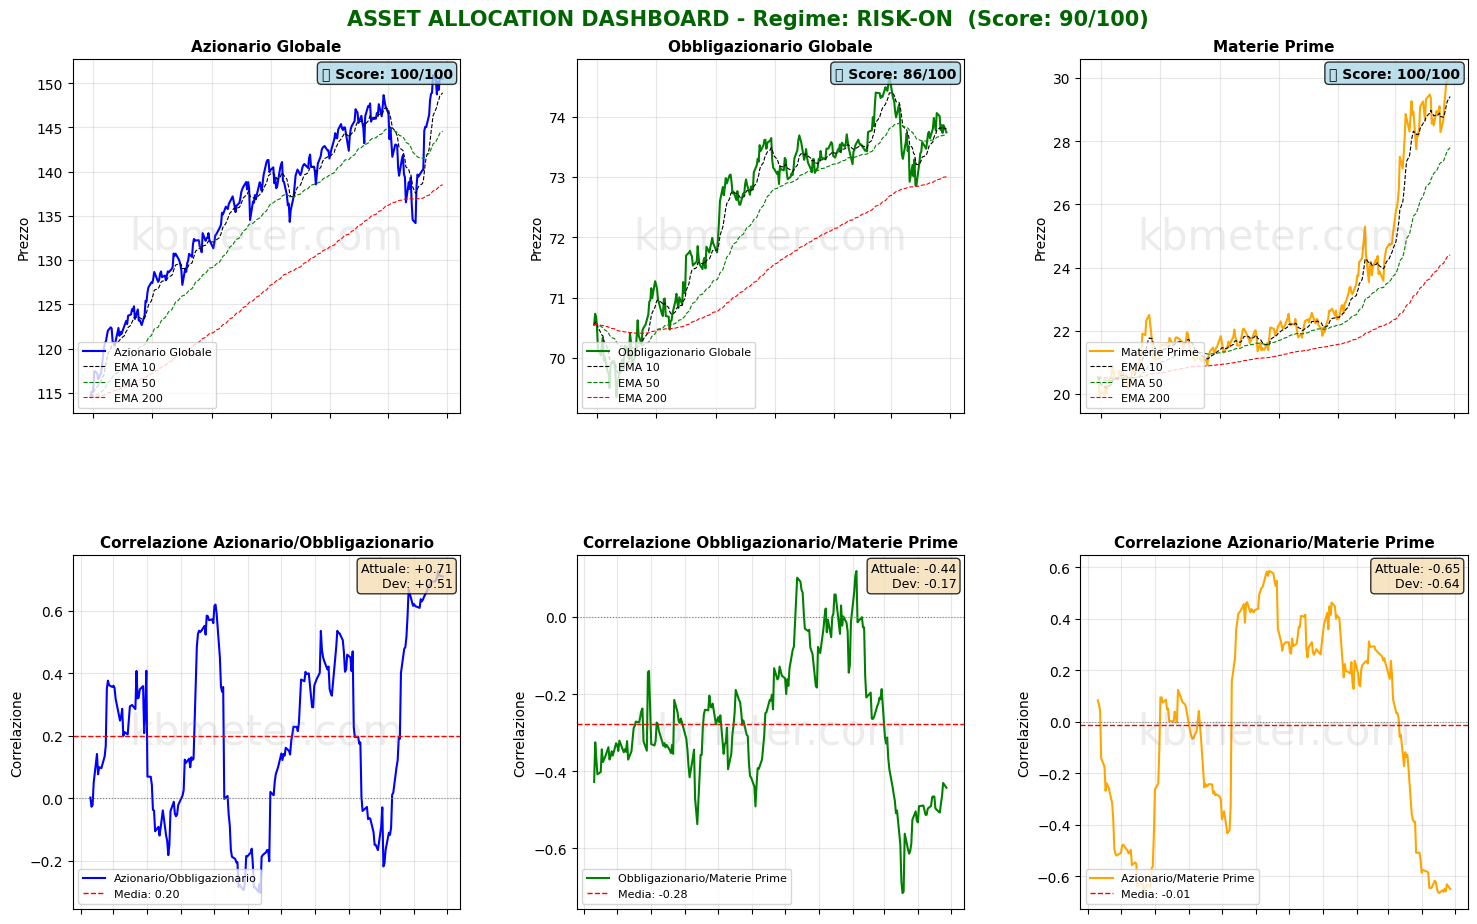
Asset classes confirm this picture, with both global equities and bonds remaining above their medium-term moving averages, but showing much less momentum and increased volatility.
Global Futures – Pre-Market Sentiment
Pre-Market Futures: Global futures indicate a moderately risk-off sentiment (average -0.08%), with the US slightly negative (-0.01%), Europe slightly positive (+0.01%), and Asia slightly negative (-0.45%).
📊 Global Futures – Pre-Market Sentiment
- Euro Stoxx 50 derived: +0.31%
- Mini DAX: +0.22%
- FTSE MIB derived: +0.16%
- Hang Seng derived: -0.85%
- Nikkei 225 derived: -0.51%
- TecDAX derived: -0.48%
Intermarket details
📄 Detailed Intermarket Analysis
INTERMARKET ANALYSIS - 2026-04-28
============================================================

MARKET HEALTH SCORE: 70.0/100
SENTIMENT: BULLISH

============================================================
MAIN RATIOS SUMMARY
============================================================


DJ/Gold:
  - Component score: 65.0/100
  - Current value: 10.5163
  - Position vs EMA50: ABOVE
  - 20-day ROC: +4.59%
  - 50-day ROC: +4.71%
  → Preference for risk assets vs safe haven

Gold/USD:
  - Component score: 55.0/100
  - Current value: 47.4756
  - Position vs EMA50: BELOW
  - 20-day ROC: +5.85%
  - 50-day ROC: -6.54%

Oil/Gold:
  - Component score: 75.0/100
  - Current value: 0.0206
  - Position vs EMA50: ABOVE
  - 20-day ROC: -7.08%
  - 50-day ROC: +61.50%
  → Declining energy demand

SP500/VIX:
  - Component score: 95.0/100
  - Current value: 398.1082
  - Position vs EMA50: ABOVE
  - 20-day ROC: +94.09%
  - 50-day ROC: +21.31%
  → Expanding risk appetite

Commodities/T30y:
  - Component score: 95.0/100
  - Current value: 0.3487
  - Position vs EMA50: ABOVE
  - 20-day ROC: +2.23%
  - 50-day ROC: +29.80%
  → Economic growth expectations

SP500/Nasdaq:
  - Component score: 0.0/100
  - Current value: 0.2883
  - Position vs EMA50: BELOW
  - 20-day ROC: -5.19%
  - 50-day ROC: -4.67%
  - ⚠️ ANOMALY DETECTED - Significant deviation from average

============================================================
CONCLUSIONS AND RECOMMENDATIONS
============================================================

The market shows signs of broad strength. Intermarket ratios suggest
a risk-friendly environment. High risk appetite and positive trends.
Positioning: CONSTRUCTIVE on risk assets.


STRONGEST RATIOS:
  • SP500/VIX: 95.0/100
  • Commodities/T30y: 95.0/100
  • Oil/Gold: 75.0/100

WEAKEST RATIOS:
  • DJ/Gold: 65.0/100
  • Gold/USD: 55.0/100
  • SP500/Nasdaq: 0.0/100

============================================================
Analysis automatically generated by kbmeter.com
Date: 2026-04-28
📄 Detailed Asset Allocation Analysis
ASSET ALLOCATION & REGIME ANALYSIS - 2026-04-28
======================================================================

MARKET REGIME: RISK-ON
REGIME SCORE: 90.0/100

======================================================================
TREND AND VOLATILITY ANALYSIS
======================================================================

GLOBAL EQUITIES (ACWI):
  Short Trend (5d): +1.19% | ABOVE EMA 10
  Medium Trend (20d): +12.16% | ABOVE EMA 50
  Long Trend (60d): +3.44% | ABOVE EMA 200

  5d Volatility: 14.2%
  20d Volatility: 17.1%
  60d Volatility: 17.7%

COMMODITIES (DBC):
  Medium Trend (20d): +2.84% | ABOVE EMA 50
  20d Volatility: 21.7%

ACWI/BND Correlation (30d): 0.710

REGIME INTERPRETATION:
The market is in a risk-on regime. Equities show positive trends across multiple
time horizons and volatility remains contained. Investors favor risk assets.
Suggested positioning: OVERWEIGHT equities.

======================================================================
ASSET RANKING - WHO IS DOING BEST?
======================================================================

🥇 1. Global Equities (ACWI) - SCORE: 100/100
     Price: $150.51
     Trend: ABOVE EMA10 | ABOVE EMA50 | ABOVE EMA200
     Performance: 5d +1.19% | 20d +12.16% | 60d +3.44%
     Volatility: 5d 14.2% | 20d 17.1% | 60d 17.7%
     Drawdown: -0.26%
     → Asset in STRONG HEALTH: positive trends and controlled volatility

🥈 2. Commodities (DBC) - SCORE: 100/100
     Price: $30.09
     Trend: ABOVE EMA10 | ABOVE EMA50 | ABOVE EMA200
     Performance: 5d +3.01% | 20d +2.84% | 60d +23.17%
     Volatility: 5d 11.6% | 20d 21.7% | 60d 26.4%
     Drawdown: 0.00%
     → Asset in STRONG HEALTH: positive trends and controlled volatility

🥉 3. Global Bonds (BND) - SCORE: 86/100
     Price: $73.74
     Trend: BELOW EMA10 | ABOVE EMA50 | ABOVE EMA200
     Performance: 5d -0.05% | 20d +0.70% | 60d +0.31%
     Volatility: 5d 3.3% | 20d 3.4% | 60d 4.2%
     Drawdown: -1.27%
     → Asset in STRONG HEALTH: positive trends and controlled volatility

======================================================================
CORRELATION ANALYSIS - CURRENT vs HISTORICAL
======================================================================

ACWI/BND:
  Current correlation (30d): +0.710
  Historical average (1 year): +0.201
  Deviation: +0.509
  ⚠️ SIGNIFICANT DEVIATION from historical average
  → Positive correlation: diversification IMPAIRED

BND/DBC:
  Current correlation (30d): -0.443
  Historical average (1 year): -0.276
  Deviation: -0.167

ACWI/DBC:
  Current correlation (30d): -0.650
  Historical average (1 year): -0.014
  Deviation: -0.636
  ⚠️ SIGNIFICANT DEVIATION from historical average
  → Negative correlation: possible supply-driven shift

======================================================================
OPERATIONAL SUMMARY
======================================================================

STRONGEST ASSET: Global Equities (Score: 100/100)
WEAKEST ASSET: Global Bonds (Score: 86/100)

SUGGESTED ACTION: Favor the strongest asset, maintain risk exposure.
DIVERSIFICATION: POOR - Asset classes tend to move together.

======================================================================
Analysis automatically generated by kbmeter.com
Date: 2026-04-28
Macroeconomic calendar
Today’s macroeconomic calendar is focused primarily on the decision by the Japanese central bank (rates unchanged). Also worth monitoring are retail sales data from Spain, consumer inflation expectations in the Eurozone, the weekly ADP report, US house price trends, and industrial production in India.
On the earnings front, while markets await results from the Magnificent Seven, today’s releases include, among others, Coca-Cola, Visa, Novartis, UPS, Seagate, and Booking.
Already a subscriber? Login here
NOTES AND WARNINGS
Data compiled by kbmeter.com. Analysis date: 28 April 2026 - 7:54 AM GMT+1
This content is provided for informational purposes only and should not be considered financial advice. All scores and assessments are based on the previous trading day’s closing prices. Futures indications refer to the date and time of the analysis.