Financial markets attempt to shake off risk-off mood amid divided Fed and PCE inflation in focus
While awaiting the PCE inflation data, financial markets are acknowledging the deep divisions over the Fed’s next monetary policy moves. And as fears on the AI front ease, investors are trying to be slightly more confident, hoping for good news from the PCE inflation data that will be released tomorrow. Sentiment remains neutral, but risk-off signals are becoming somewhat weaker. Futures indicate a positive opening for Europe and a stable one for the United States.
Market Weather Map
February 19, 2026
US Equities
Eu Equities
Asia Equities
Commodities
Bonds
Dollar Index
Technology
Gold
Oil
Crypto
Market Summary
How to interpret our financial indicators? Find out here.
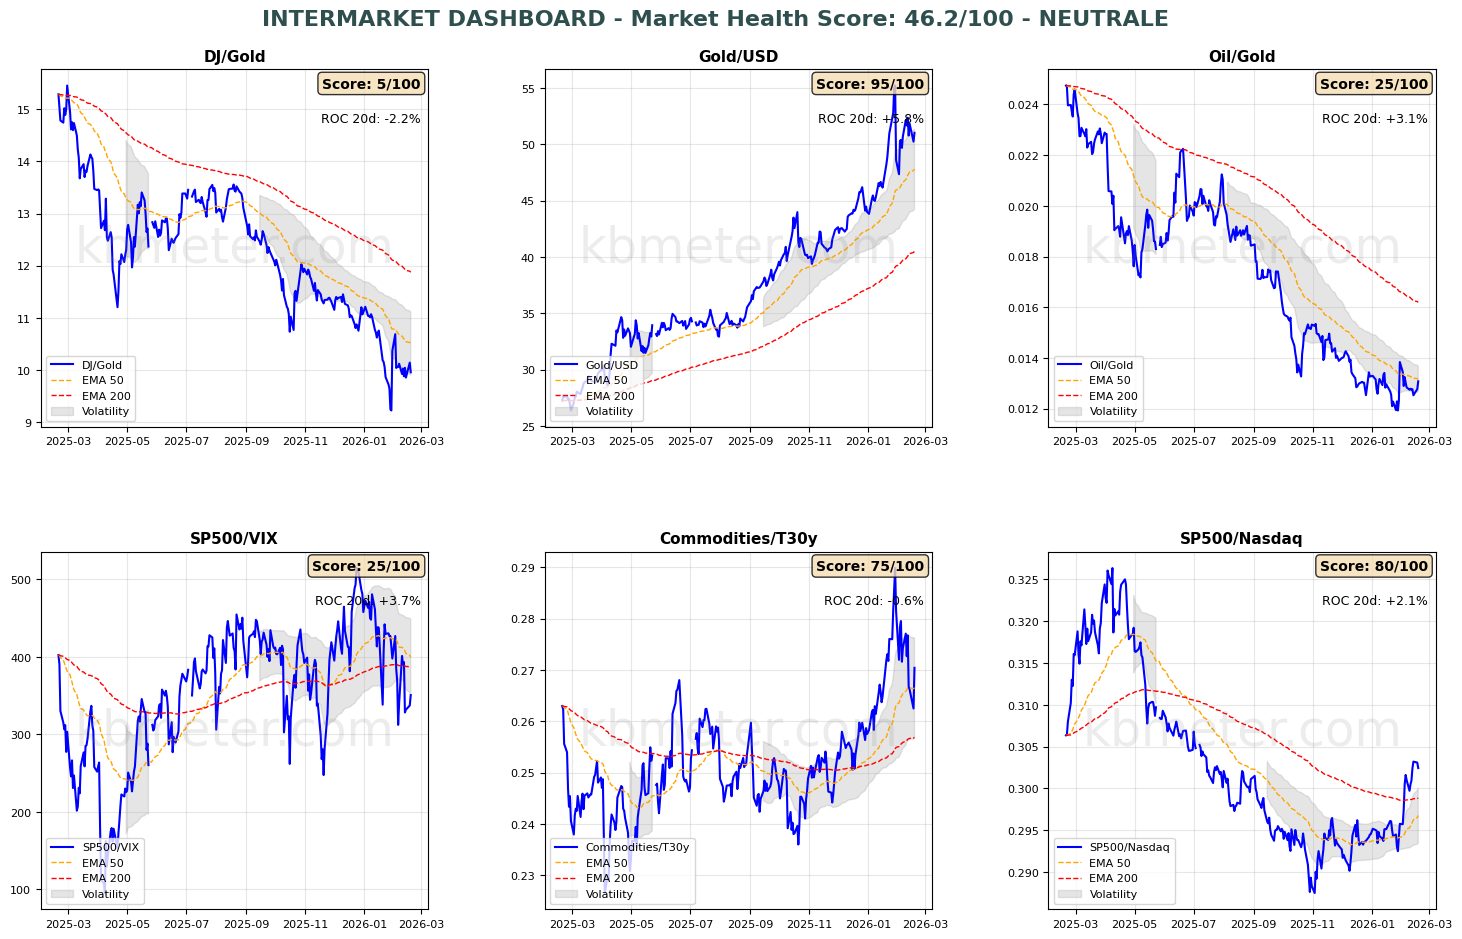
Financial markets today show a neutral / slightly positive sentiment. Intermarket analysis highlights a Market Health Score of 46/100 (neutral). Our intermarket dashboards continue to signal a situation characterized by uncertainty. Risk indicators remain weak, but at the same time risk-off signals are diminishing. Global bonds continue their strong phase on expectations of declining interest rates and controlled inflation. Global equities confirm a decline in momentum, but the medium-term trend remains intact. Volatility persists in commodities.
Pre-Market Futures: Global futures signal a moderate risk-on sentiment (average +0.22%), with the US slightly positive (+0.04%), Europe slightly positive (+0.49%), and Asia slightly negative (-0.36%).
📊 Global Futures – Pre-Market Sentiment
- TecDAX derived: +1.94%
- FTSE MIB derived: +1.30%
- IBEX 35 derived: +1.05%
- CSI 300: -1.69%
- DAX derived: -0.30%
- Mini DAX: -0.26%
📄 Detailed Intermarket Analysis
INTERMARKET ANALYSIS - 2026-02-19
============================================================

MARKET HEALTH SCORE: 46.2/100
SENTIMENT: NEUTRAL

============================================================
MAIN RATIOS SUMMARY
============================================================


DJ/Gold:
  - Component score: 5.0/100
  - Current value: 9.9594
  - Position vs EMA50: BELOW
  - 20-day ROC: -2.24%
  - 50-day ROC: -12.34%
  → Flight to safe havens

Gold/USD:
  - Component score: 95.0/100
  - Current value: 51.0389
  - Position vs EMA50: ABOVE
  - 20-day ROC: +5.78%
  - 50-day ROC: +19.96%

Oil/Gold:
  - Component score: 25.0/100
  - Current value: 0.0131
  - Position vs EMA50: BELOW
  - 20-day ROC: +3.12%
  - 50-day ROC: -7.72%
  → Rising energy demand

SP500/VIX:
  - Component score: 25.0/100
  - Current value: 350.7293
  - Position vs EMA50: BELOW
  - 20-day ROC: +3.67%
  - 50-day ROC: -19.29%

Commodities/T30y:
  - Component score: 75.0/100
  - Current value: 0.2704
  - Position vs EMA50: ABOVE
  - 20-day ROC: -0.59%
  - 50-day ROC: +5.95%
  → Economic growth expectations

SP500/Nasdaq:
  - Component score: 80.0/100
  - Current value: 0.3024
  - Position vs EMA50: ABOVE
  - 20-day ROC: +2.14%
  - 50-day ROC: +3.67%
  - ⚠️ ANOMALY DETECTED - Significant deviation from the average

============================================================
CONCLUSIONS AND RECOMMENDATIONS
============================================================

The market is in a neutral/sideways phase. Conflicting signals among the various ratios.
There is no clear direction. Wait for confirmation.
Positioning: BALANCED, avoid excess exposure.


STRONGEST RATIOS:
  • Gold/USD: 95.0/100
  • SP500/Nasdaq: 80.0/100
  • Commodities/T30y: 75.0/100

WEAKEST RATIOS:
  • Oil/Gold: 25.0/100
  • SP500/VIX: 25.0/100
  • DJ/Gold: 5.0/100

============================================================
Analysis automatically generated by kbmeter.com
Date: 2026-02-19
📄 Detailed Asset Allocation Analysis
ASSET ALLOCATION & REGIME ANALYSIS - 2026-02-19
======================================================================
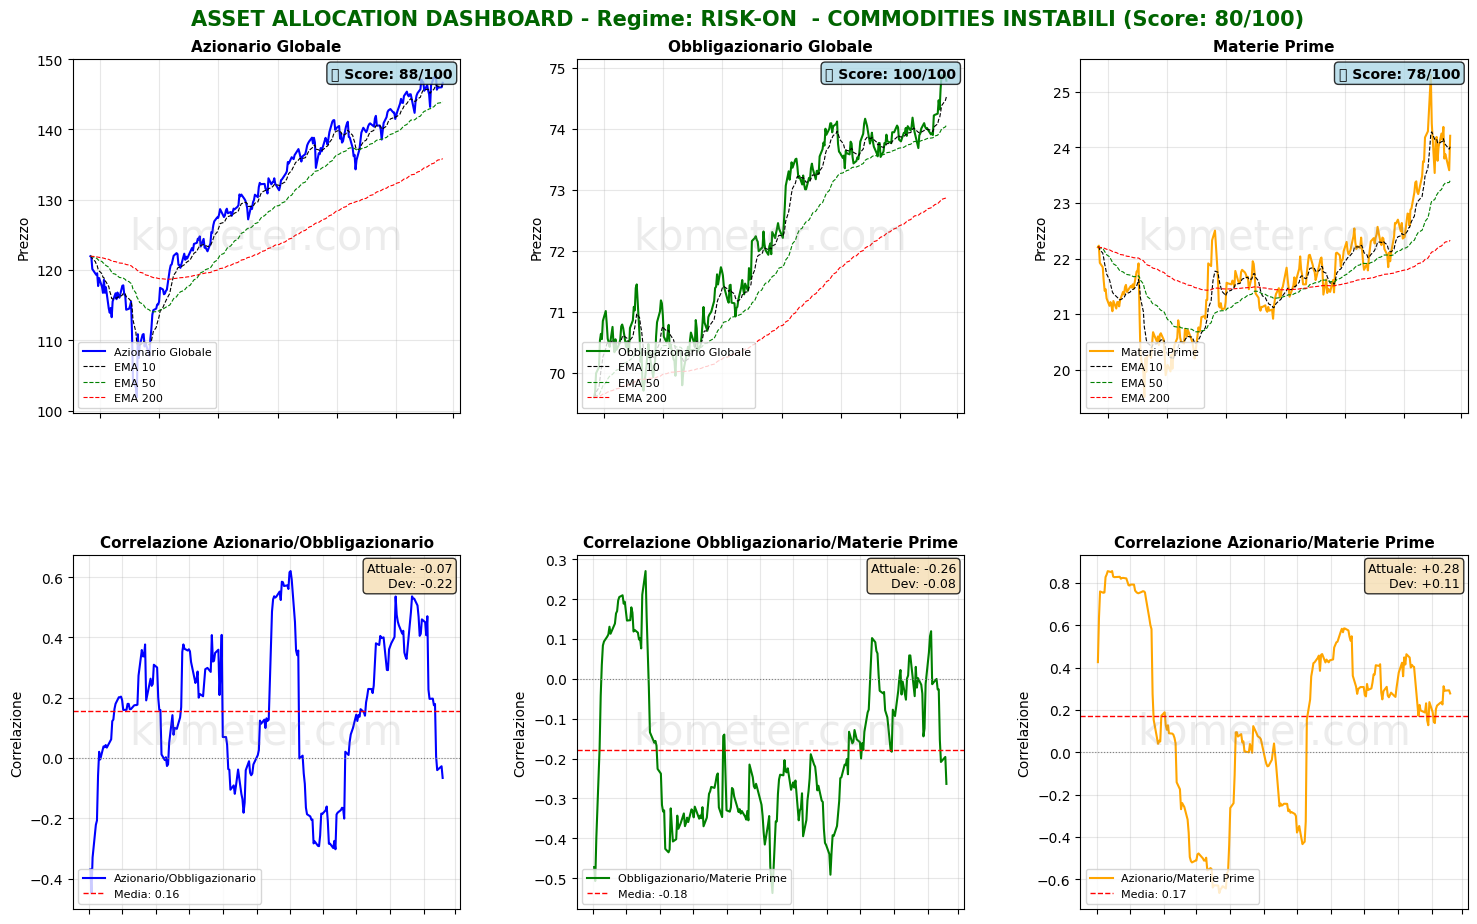
MARKET REGIME: RISK-ON - UNSTABLE COMMODITIES
REGIME SCORE: 80.0/100
======================================================================
TREND AND VOLATILITY ANALYSIS
======================================================================
GLOBAL EQUITIES (ACWI):
Short Trend (5d): -0.73% | ABOVE EMA 10
Medium Trend (20d): +1.82% | ABOVE EMA 50
Long Trend (60d): +9.16% | ABOVE EMA 200
Volatility 5d: 11.8%
Volatility 20d: 12.9%
Volatility 60d: 11.3%
COMMODITIES (DBC):
Medium Trend (20d): +1.94% | ABOVE EMA 50
Volatility 20d: 28.7%
Correlation ACWI/BND (30d): -0.066
REGIME INTERPRETATION:
The market is in a risk-on regime. Equities show positive trends across multiple time
horizons and volatility remains contained. Investors favor risk assets.
Suggested positioning: OVERWEIGHT equities.
⚠️ COMMODITIES ALERT: Commodities show elevated volatility. This may
indicate uncertainty about economic growth or unstable supply/demand dynamics.
======================================================================
ASSET RANKING - TOP PERFORMERS
======================================================================
🥇 1. Global Bonds (BND) - SCORE: 100/100
Price: $74.79
Trend: ABOVE EMA10 | ABOVE EMA50 | ABOVE EMA200
Performance: 5d +0.63% | 20d +1.21% | 60d +1.60%
Volatility: 5d 4.4% | 20d 2.9% | 60d 2.9%
Drawdown: -0.12%
→ Asset in STRONG HEALTH: positive trends and controlled volatility
🥈 2. Global Equities (ACWI) - SCORE: 88/100
Price: $146.63
Trend: ABOVE EMA10 | ABOVE EMA50 | ABOVE EMA200
Performance: 5d -0.73% | 20d +1.82% | 60d +9.16%
Volatility: 5d 11.8% | 20d 12.9% | 60d 11.3%
Drawdown: -0.73%
→ Asset in STRONG HEALTH: positive trends and controlled volatility
🥉 3. Commodities (DBC) - SCORE: 78/100
Price: $24.21
Trend: ABOVE EMA10 | ABOVE EMA50 | ABOVE EMA200
Performance: 5d -0.66% | 20d +1.94% | 60d +10.34%
Volatility: 5d 30.6% | 20d 28.7% | 60d 19.6%
Drawdown: -4.31%
→ Asset in STRONG HEALTH: positive trends and controlled volatility
======================================================================
CORRELATION ANALYSIS - CURRENT vs HISTORICAL
======================================================================
ACWI/BND:
Current correlation (30d): -0.066
Historical average (1 year): +0.157
Deviation: -0.223
→ Weak correlation: moderate diversification
BND/DBC:
Current correlation (30d): -0.263
Historical average (1 year): -0.179
Deviation: -0.084
ACWI/DBC:
Current correlation (30d): +0.278
Historical average (1 year): +0.170
Deviation: +0.107
======================================================================
OPERATIONAL SUMMARY
======================================================================
STRONGEST ASSET: Global Bonds (Score: 100/100)
WEAKEST ASSET: Commodities (Score: 78/100)
SUGGESTED ACTION: Favor the strongest asset, maintain risk exposure.
DIVERSIFICATION: EXCELLENT - Asset classes are moving independently.
======================================================================
Analysis automatically generated by kbmeter.com
Date: 2026-02-19
On the macroeconomic front, today’s agenda includes US trade balance data for December 2025, the February Philly Fed update, the flash estimate of consumer confidence in the Euro area, and US jobless claims data.
As for earnings, Walmart’s results are expected today, a key bellwether for consumer trends in the United States.
Already a subscriber? Login here
NOTES AND WARNINGS
Analysis automatically generated by kbmeter.com. Analysis date: 19 February 2026 - 7:39 AM GMT+1
This content is provided for informational purposes only and should not be considered financial advice. All scores and assessments are based on the previous trading day’s closing prices. Futures indications refer to the date and time of the analysis.