Ceasefire in Iran Boosts Risk Assets After Day of Market Stress
The announcement of a two-week ceasefire in the Middle East, along with some optimism about the possibility of an agreement, is boosting futures (sharply higher in both Europe and the United States) and clearly outweighing the signals that emerged during yesterday’s trading session. Sentiment is neutral but improving, while volatility remains elevated. It could be a very negative day for oil, in favor of equities, bonds, and gold.
Market Weather Map
April 8, 2026
US Equities
Eu Equities
Asia Equities
Commodities
Bonds
Dollar Index
Technology
Gold
Oil
Crypto
Market Summary
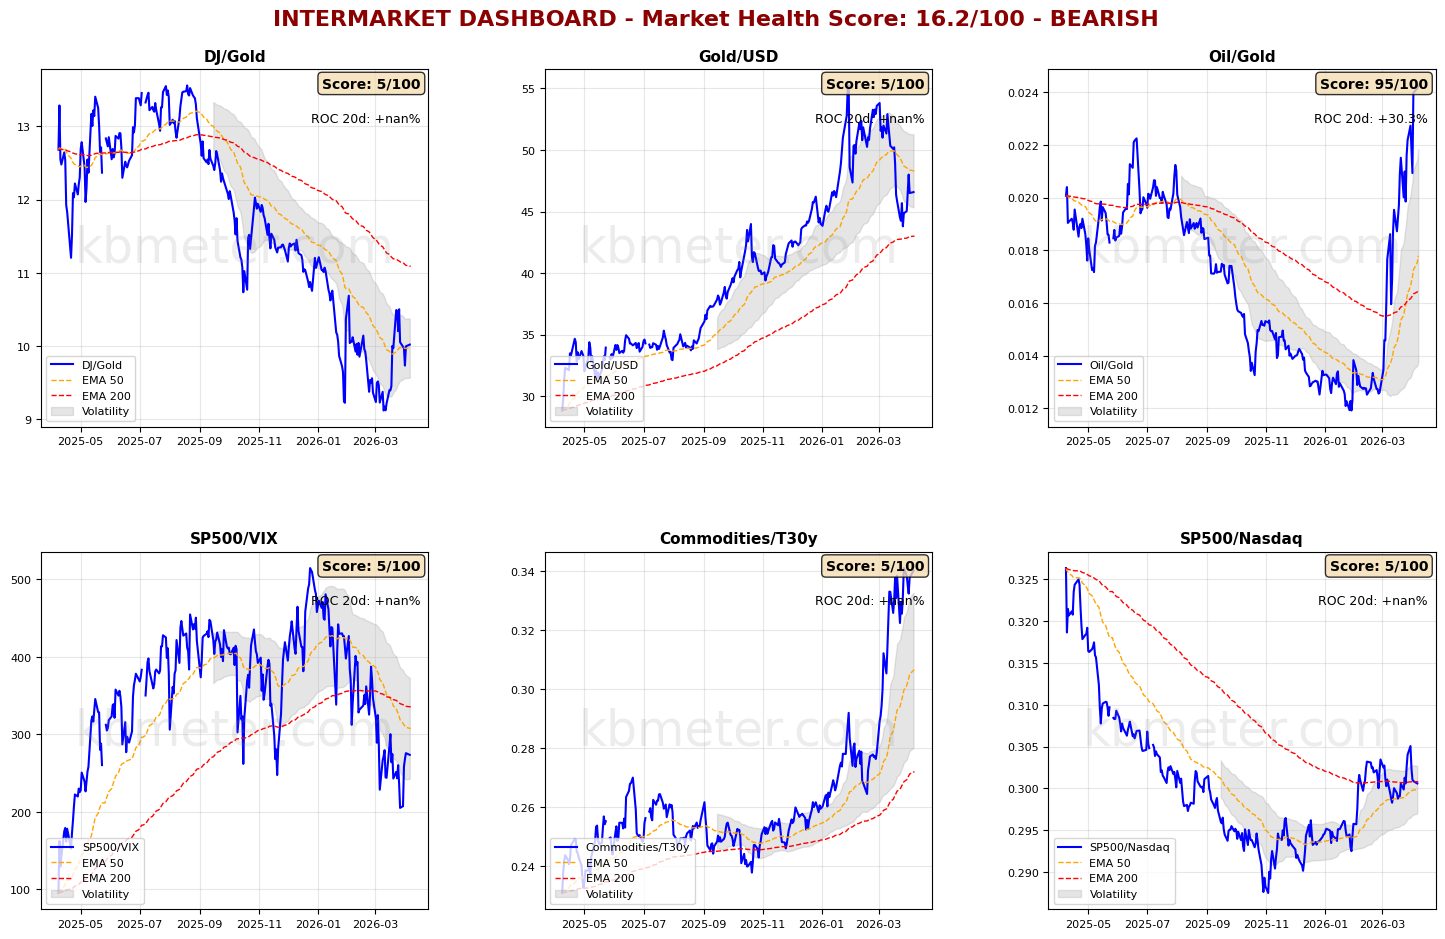
Financial markets today show a neutral sentiment. Intermarket analysis highlights a Market Health Score of 16/100 (negative). Our intermarket dashboards do not yet incorporate the wave of optimism that emerged during the U.S. evening yesterday following the announcement of the two-week ceasefire in the Middle East. During a session marked by tension, risk appetite indicators had not moved away from the cautious stance we had previously indicated. The same asset classes under pressure (equities and bonds) had begun to position themselves slightly further away from the critical support levels of long-term moving averages.
Pre-Opening Futures: Global futures indicate a risk-on sentiment (+2.40% on average), with the U.S. very positive (+2.87%), Europe very positive (+2.20%), and Asia very positive (+2.39%). Futures point to a strong bullish opening (+2.40% on average).
📊 Global Futures – Pre-Opening Sentiment
- Euro Stoxx 50 derived: +5.48%
- Mini DAX: +5.20%
- DAX derived: +4.99%
- TecDAX derived: -1.03%
- FTSE MIB derived: -0.48%
- Mini MDAX derived: +0.00%
📄 Detailed Intermarket Analysis
INTERMARKET ANALYSIS - 2026-04-08
============================================================

MARKET HEALTH SCORE: 16.2/100
SENTIMENT: BEARISH

============================================================
MAIN RATIOS SUMMARY
============================================================


DJ/Gold:
  - Component score: 5.0/100
  - Current value: nan
  - Position vs EMA50: BELOW
  - 20-day ROC: +nan%
  - 50-day ROC: +nan%
  → Flight to safe haven

Gold/USD:
  - Component score: 5.0/100
  - Current value: nan
  - Position vs EMA50: BELOW
  - 20-day ROC: +nan%
  - 50-day ROC: +nan%

Oil/Gold:
  - Component score: 95.0/100
  - Current value: 0.0243
  - Position vs EMA50: ABOVE
  - 20-day ROC: +30.30%
  - 50-day ROC: +97.62%
  → Increasing energy demand

SP500/VIX:
  - Component score: 5.0/100
  - Current value: nan
  - Position vs EMA50: BELOW
  - 20-day ROC: +nan%
  - 50-day ROC: +nan%

Commodities/T30y:
  - Component score: 5.0/100
  - Current value: nan
  - Position vs EMA50: BELOW
  - 20-day ROC: +nan%
  - 50-day ROC: +nan%
  → Slowdown expectations

SP500/Nasdaq:
  - Component score: 5.0/100
  - Current value: nan
  - Position vs EMA50: BELOW
  - 20-day ROC: +nan%
  - 50-day ROC: +nan%

============================================================
CONCLUSIONS AND RECOMMENDATIONS
============================================================

The market is in bearish territory. Widespread stress signals.
Ongoing risk-off environment. Maximum caution advised.
Positioning: VERY DEFENSIVE, capital preservation.


STRONGEST RATIOS:
  • Oil/Gold: 95.0/100
  • DJ/Gold: 5.0/100
  • Gold/USD: 5.0/100

WEAKEST RATIOS:
  • SP500/VIX: 5.0/100
  • Commodities/T30y: 5.0/100
  • SP500/Nasdaq: 5.0/100

============================================================
Analysis automatically generated by kbmeter.com
Date: 2026-04-08
📄 Detailed Asset Allocation Analysis
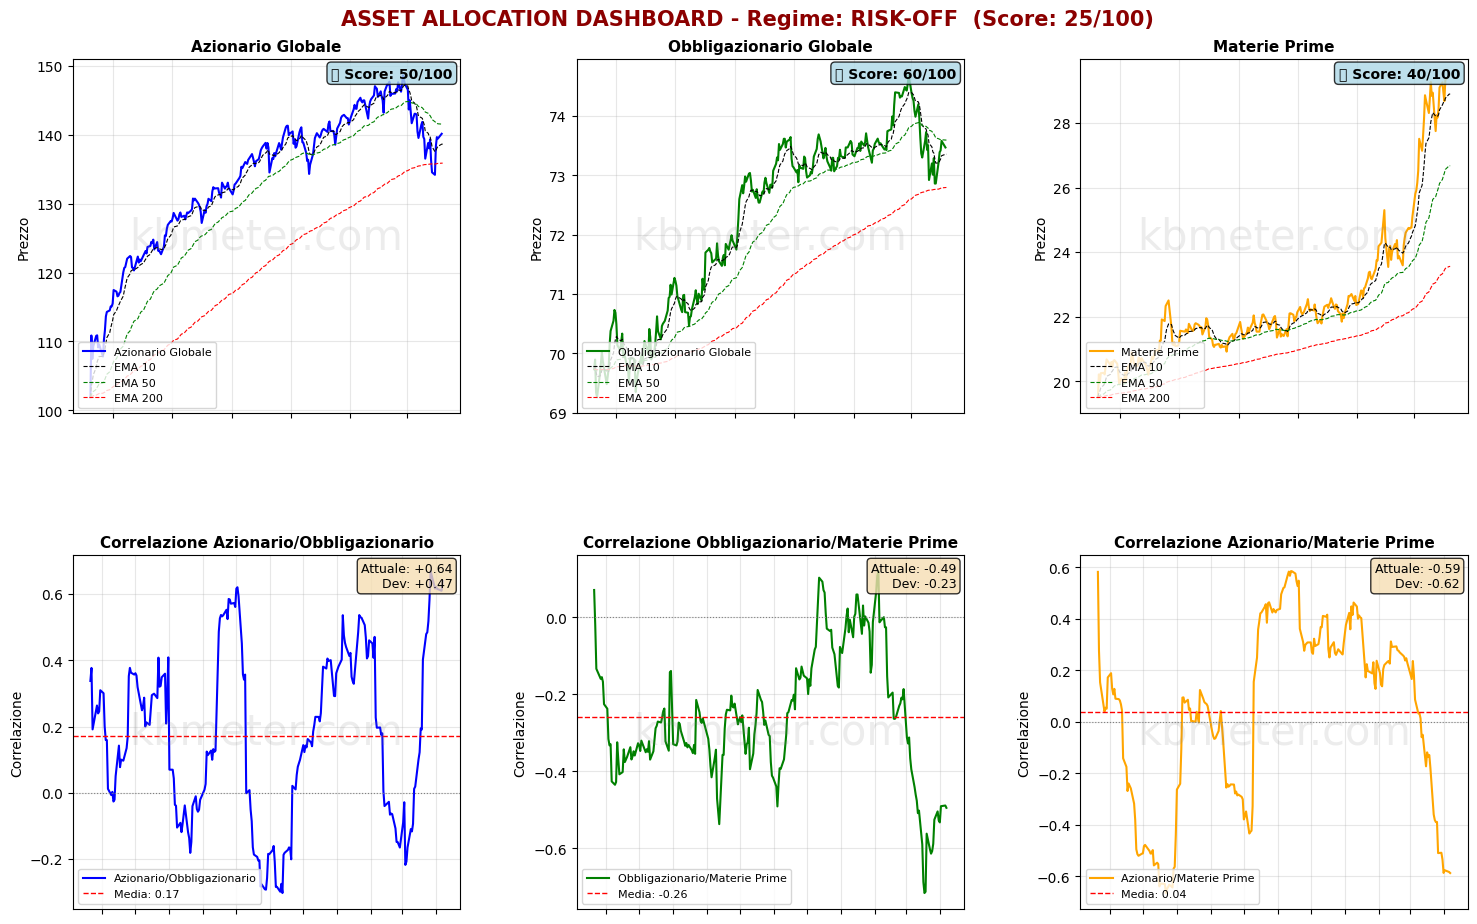
ASSET ALLOCATION & REGIME ANALYSIS - 2026-04-08
======================================================================

MARKET REGIME: RISK-OFF
REGIME SCORE: 25.0/100

======================================================================
TREND AND VOLATILITY ANALYSIS
======================================================================

GLOBAL EQUITIES (ACWI):
  Short-Term Trend (5d): +nan% | BELOW EMA 10
  Medium-Term Trend (20d): +nan% | BELOW EMA 50
  Long-Term Trend (60d): +nan% | BELOW EMA 200

  Volatility 5d: 21.0%
  Volatility 20d: 20.9%
  Volatility 60d: 16.3%

COMMODITIES (DBC):
  Medium-Term Trend (20d): +nan% | BELOW EMA 50
  Volatility 20d: 26.7%

Correlation ACWI/BND (30d): 0.639

REGIME INTERPRETATION:
The market is in a risk-off regime. Negative trends across multiple horizons and/or elevated volatility.
Flight to safe-haven assets.
Suggested positioning: DEFENSIVE, capital preservation.

======================================================================
ASSET RANKING - WHO IS PERFORMING BETTER?
======================================================================

🥇 1. Global Bonds (BND) - SCORE: 60/100
     Price: $nan
     Trend: BELOW EMA10 | BELOW EMA50 | BELOW EMA200
     Performance: 5d +nan% | 20d +nan% | 60d +nan%
     Volatility: 5d 2.5% | 20d 5.7% | 60d 4.1%
     Drawdown: nan%
     → Asset in FAIR condition: mostly positive signals

🥈 2. Global Equities (ACWI) - SCORE: 50/100
     Price: $nan
     Trend: BELOW EMA10 | BELOW EMA50 | BELOW EMA200
     Performance: 5d +nan% | 20d +nan% | 60d +nan%
     Volatility: 5d 21.0% | 20d 20.9% | 60d 16.3%
     Drawdown: nan%
     → Asset in NEUTRAL condition: mixed signals

🥉 3. Commodities (DBC) - SCORE: 40/100
     Price: $nan
     Trend: BELOW EMA10 | BELOW EMA50 | BELOW EMA200
     Performance: 5d +nan% | 20d +nan% | 60d +nan%
     Volatility: 5d 21.4% | 20d 26.7% | 60d 24.8%
     Drawdown: nan%
     → Asset in WEAK condition: negative trends or high volatility

======================================================================
CORRELATION ANALYSIS - CURRENT vs HISTORICAL
======================================================================

ACWI/BND:
  Current correlation (30d): +0.639
  Historical average (1 year): +0.171
  Deviation: +0.468
  ⚠️ SIGNIFICANT DEVIATION from historical average
  → Positive correlation: diversification COMPROMISED

BND/DBC:
  Current correlation (30d): -0.495
  Historical average (1 year): -0.260
  Deviation: -0.235

ACWI/DBC:
  Current correlation (30d): -0.587
  Historical average (1 year): +0.036
  Deviation: -0.623
  ⚠️ SIGNIFICANT DEVIATION from historical average
  → Negative correlation: possible supply-driven shift

======================================================================
OPERATIONAL SUMMARY
======================================================================

STRONGEST ASSET: Global Bonds (Score: 60/100)
WEAKEST ASSET: Commodities (Score: 40/100)

SUGGESTED ACTION: Reduce exposure to the weakest asset, favor defensive positioning.
DIVERSIFICATION: GOOD - Diversification benefits present.

======================================================================
Analysis automatically generated by kbmeter.com
Date: 2026-04-08
On the macro front, today’s agenda includes data on German industrial orders for February 2026, as well as retail sales and producer prices in the Euro area for last February. Finally, the minutes from the Federal Reserve’s latest meeting will be released in the United States.
Already a subscriber? Login here
NOTES AND WARNINGS
Data compiled by kbmeter.com. Analysis date: 8 April 2026 - 7:33 AM GMT+1
This content is provided for informational purposes only and should not be considered financial advice. All scores and assessments are based on the previous trading day’s closing prices. Futures indications refer to the date and time of the analysis.