Bond Markets Remain Under Pressure as Investors Seek Positive Catalysts Ahead of Nvidia Earnings
On the highly anticipated day of Nvidia’s earnings release, financial markets once again find themselves balanced between optimism toward the technology sector and concerns over inflation. Global bonds remain below their long-term moving average, but cracks are also beginning to appear in equities. Market sentiment stays between neutral and moderately positive, while volatility remains at moderate levels. The situation is worsening for cryptocurrencies, while rising yields and a strong dollar are weighing on gold and Asian markets. Futures point to a negative opening for Europe and a slightly weaker start for the United States.
Market Weather Map
May 20, 2026
US Equities
Eu Equities
Asia Equities
Commodities
Bonds
Dollar Index
Technology
Gold
Oil
Crypto
Market Summary
Financial markets sentiment
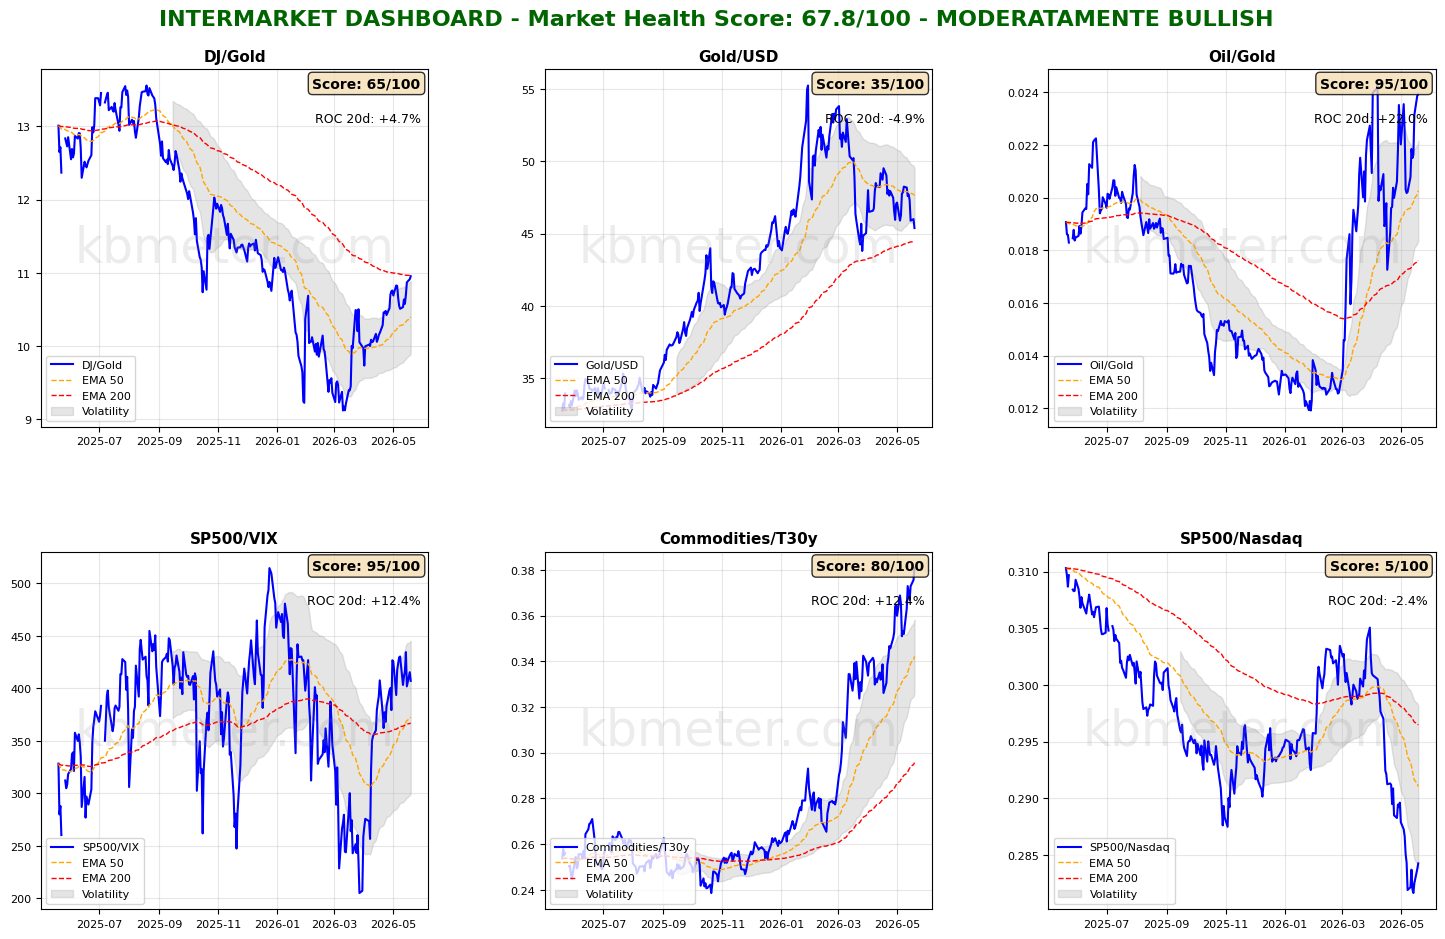
Financial markets today are showing a neutral to moderately positive sentiment. Intermarket analysis highlights a Market Health Score of 68/100 (moderately positive). Our intermarket dashboards are displaying some interesting signals. On the eve of Nvidia’s earnings report, the S&P 500/Nasdaq ratio is extending its rebound from recent lows, while at the same time the Commodities/Bonds ratio continues to rise. Gold is losing strength against Oil, the Dollar, and the Dow. The Dow/Gold ratio is approaching the resistance represented by the long-term moving average. The S&P 500/VIX ratio (a measure of market risk appetite) is moving sideways in the very short term, while still remaining within a short-term uptrend (with a possible bullish crossover between the 50-day and 200-day moving averages).
The overall impression from these charts is that fears of persistent inflation are gradually eroding the solid wall of optimism supporting equities. The market is beginning to raise its guard while waiting for macroeconomic data and reassuring signals.
This is clearly visible across asset classes and in the market wheater map. Global equities have slipped below the 10-day moving average, while global bonds are deepening their decline below the 200-day moving average and entering a high-risk zone for further weakness.
The wheater map shows how a strong dollar is weighing on gold and Asian equity markets, while oil and technology stocks remain above the 60-point score threshold. Bonds remain weak but stable, while the outlook for cryptocurrencies continues to deteriorate.
Global Futures – Pre-Market Sentiment
Pre-market futures indicate a moderate risk-off sentiment globally (average -0.46%), with U.S. futures slightly negative (-0.14%), Europe negative (-0.61%), and Asia slightly negative (-0.45%).
📊 Global Futures – Pre-Market Sentiment
- CSI 300: +0.37%
- Mini MDAX derived: +0.00%
- US Tech 100 derived: -0.01%
- TecDAX derived: -1.69%
- Nikkei 225 derived: -1.65%
- DAX derived: -0.83%
Intermarket details
📄 Detailed Intermarket Analysis
INTERMARKET ANALYSIS - 2026-05-20
============================================================

MARKET HEALTH SCORE: 67.8/100
SENTIMENT: MODERATELY BULLISH

============================================================
SUMMARY OF MAIN RATIOS
============================================================


DJ/Gold:
  - Component score: 65.0/100
  - Current value: 10.9544
  - Position vs EMA50: ABOVE
  - 20-day ROC: +4.72%
  - 50-day ROC: +16.83%
  → Preference for risk assets over safe havens

Gold/USD:
  - Component score: 35.0/100
  - Current value: 45.3807
  - Position vs EMA50: BELOW
  - 20-day ROC: -4.95%
  - 50-day ROC: -11.60%

Oil/Gold:
  - Component score: 95.0/100
  - Current value: 0.0239
  - Position vs EMA50: ABOVE
  - 20-day ROC: +21.96%
  - 50-day ROC: +28.49%
  → Growing energy demand

SP500/VIX:
  - Component score: 95.0/100
  - Current value: 407.1766
  - Position vs EMA50: ABOVE
  - 20-day ROC: +12.40%
  - 50-day ROC: +52.78%
  → Expanding risk appetite

Commodities/T30y:
  - Component score: 80.0/100
  - Current value: 0.3808
  - Position vs EMA50: ABOVE
  - 20-day ROC: +12.43%
  - 50-day ROC: +24.23%
  - ⚠️ ANOMALY DETECTED - Significant deviation from the average
  → Economic growth expectations

SP500/Nasdaq:
  - Component score: 5.0/100
  - Current value: 0.2842
  - Position vs EMA50: BELOW
  - 20-day ROC: -2.38%
  - 50-day ROC: -5.07%

============================================================
CONCLUSIONS AND RECOMMENDATIONS
============================================================

The market remains moderately constructive. Some ratios are showing positive signals,
but elements of caution persist. Monitor developments closely.
Positioning: SELECTIVE, favor quality.


STRONGEST RATIOS:
  • Oil/Gold: 95.0/100
  • SP500/VIX: 95.0/100
  • Commodities/T30y: 80.0/100

WEAKEST RATIOS:
  • DJ/Gold: 65.0/100
  • Gold/USD: 35.0/100
  • SP500/Nasdaq: 5.0/100

============================================================
Data processed by kbmeter.com
Date: 2026-05-20
📄 Detailed Asset Allocation Analysis
ASSET ALLOCATION & REGIME ANALYSIS - 2026-05-20
======================================================================
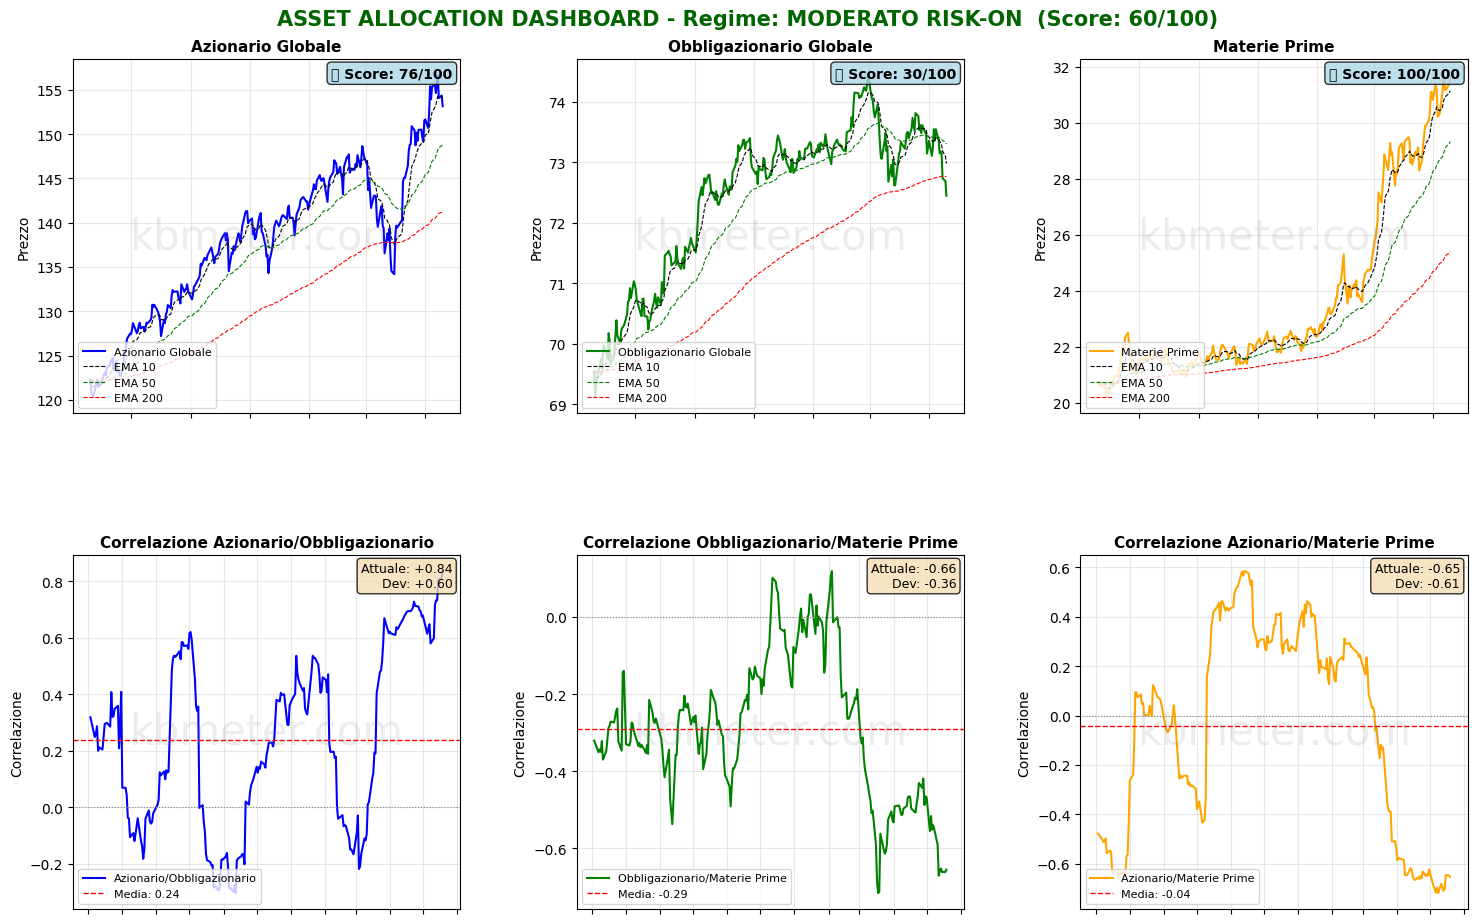
MARKET REGIME: MODERATE RISK-ON
REGIME SCORE: 60.0/100
======================================================================
TREND AND VOLATILITY ANALYSIS
======================================================================
GLOBAL EQUITIES (ACWI):
Short-Term Trend (5d): -1.75% | BELOW EMA 10
Medium-Term Trend (20d): +1.98% | ABOVE EMA 50
Long-Term Trend (60d): +3.95% | ABOVE EMA 200
5d Volatility: 15.9%
20d Volatility: 14.8%
60d Volatility: 18.0%
COMMODITIES (DBC):
Medium-Term Trend (20d): +7.12% | ABOVE EMA 50
20d Volatility: 21.1%
ACWI/BND Correlation (30d): 0.836
REGIME INTERPRETATION:
The market is showing risk appetite, but with some elements of caution.
The trend remains constructive, although there may be conflicting signals across certain time horizons.
Suggested positioning: BALANCED with a slight tilt toward risk assets.
======================================================================
ASSET RANKING - WHO IS PERFORMING BEST?
======================================================================
🥇 1. Commodities (DBC) - SCORE: 100/100
Price: $31.61
Trend: ABOVE EMA10 | ABOVE EMA50 | ABOVE EMA200
Performance: 5d +0.77% | 20d +7.12% | 60d +27.87%
Volatility: 5d 12.4% | 20d 21.1% | 60d 24.3%
Drawdown: -0.25%
→ Asset in STRONG HEALTH: positive trends and controlled volatility
🥈 2. Global Equities (ACWI) - SCORE: 76/100
Price: $153.15
Trend: BELOW EMA10 | ABOVE EMA50 | ABOVE EMA200
Performance: 5d -1.75% | 20d +1.98% | 60d +3.95%
Volatility: 5d 15.9% | 20d 14.8% | 60d 18.0%
Drawdown: -2.23%
→ Asset in STRONG HEALTH: positive trends and controlled volatility
🥉 3. Global Bonds (BND) - SCORE: 30/100
Price: $72.45
Trend: BELOW EMA10 | BELOW EMA50 | BELOW EMA200
Performance: 5d -1.00% | 20d -1.58% | 60d -2.36%
Volatility: 5d 4.1% | 20d 4.1% | 60d 4.5%
Drawdown: -2.68%
→ Asset in WEAK condition: negative trends or elevated volatility
======================================================================
CORRELATION ANALYSIS - CURRENT vs HISTORICAL
======================================================================
ACWI/BND:
Current Correlation (30d): +0.836
Historical Average (1 year): +0.238
Deviation: +0.598
⚠️ SIGNIFICANT DEVIATION from historical average
→ Positive correlation: diversification COMPROMISED
BND/DBC:
Current Correlation (30d): -0.655
Historical Average (1 year): -0.291
Deviation: -0.364
⚠️ SIGNIFICANT DEVIATION from historical average
ACWI/DBC:
Current Correlation (30d): -0.653
Historical Average (1 year): -0.042
Deviation: -0.611
⚠️ SIGNIFICANT DEVIATION from historical average
→ Negative correlation: possible supply-driven shift
======================================================================
OPERATIONAL SUMMARY
======================================================================
STRONGEST ASSET: Commodities (Score: 100/100)
WEAKEST ASSET: Global Bonds (Score: 30/100)
SUGGESTED ACTION: Favor the strongest asset while maintaining risk exposure.
DIVERSIFICATION: POOR - Asset classes tend to move together.
======================================================================
Data processed by kbmeter.com
Date: 2026-05-20
Macroeconomic Calendar
On the macro front, today’s schedule includes April 2026 inflation data from the United Kingdom and the final April inflation figures for the Eurozone. Also noteworthy are the Fed minutes and the Chinese central bank’s decision on prime lending rates.
As for earnings, as mentioned, today is all about Nvidia’s results.
Already a subscriber? Login here
NOTES AND WARNINGS
Data compiled by kbmeter.com. Analysis date: 20 May 2026 - 7:49 AM GMT+1
This content is provided for informational purposes only and should not be considered financial advice. All scores and assessments are based on the previous trading day’s closing prices. Futures indications refer to the date and time of the analysis.